Using the Optimizer PET Driver
We will now use an Optimizer Driver to find the x and y values that minimize f_xy.
In the previous Adding a PET Driver section, we used the Parameter Study driver to obtain the x and y values needed to minimize f_xy. That method was rather inefficient as it relied on a brute force sampling (961 samples) of the design space in order to obtain a reasonable estimate of the optimal x and y values.
In this section, we will introduce the Optimizer PET Driver. The Optimizer driver is better suited for optimization/minimization problems.
Note
This section of the tutorial builds on the preceding Parameter Study sections. You will need to have completed the Getting Started and Adding a PET Analysis Block sections before you start this section.
Open an existing OpenMETA Project
If the parameterstudy_tutorial.mga GME project is still open, then you can skip Steps 1-3.
- Start GME.
- Within GME, open the File menu and select Open Project….
- Left-click on the parameterstudy_tutorial.mga file that you created in the last tutorial then select Open.
Create a new PET within the Project
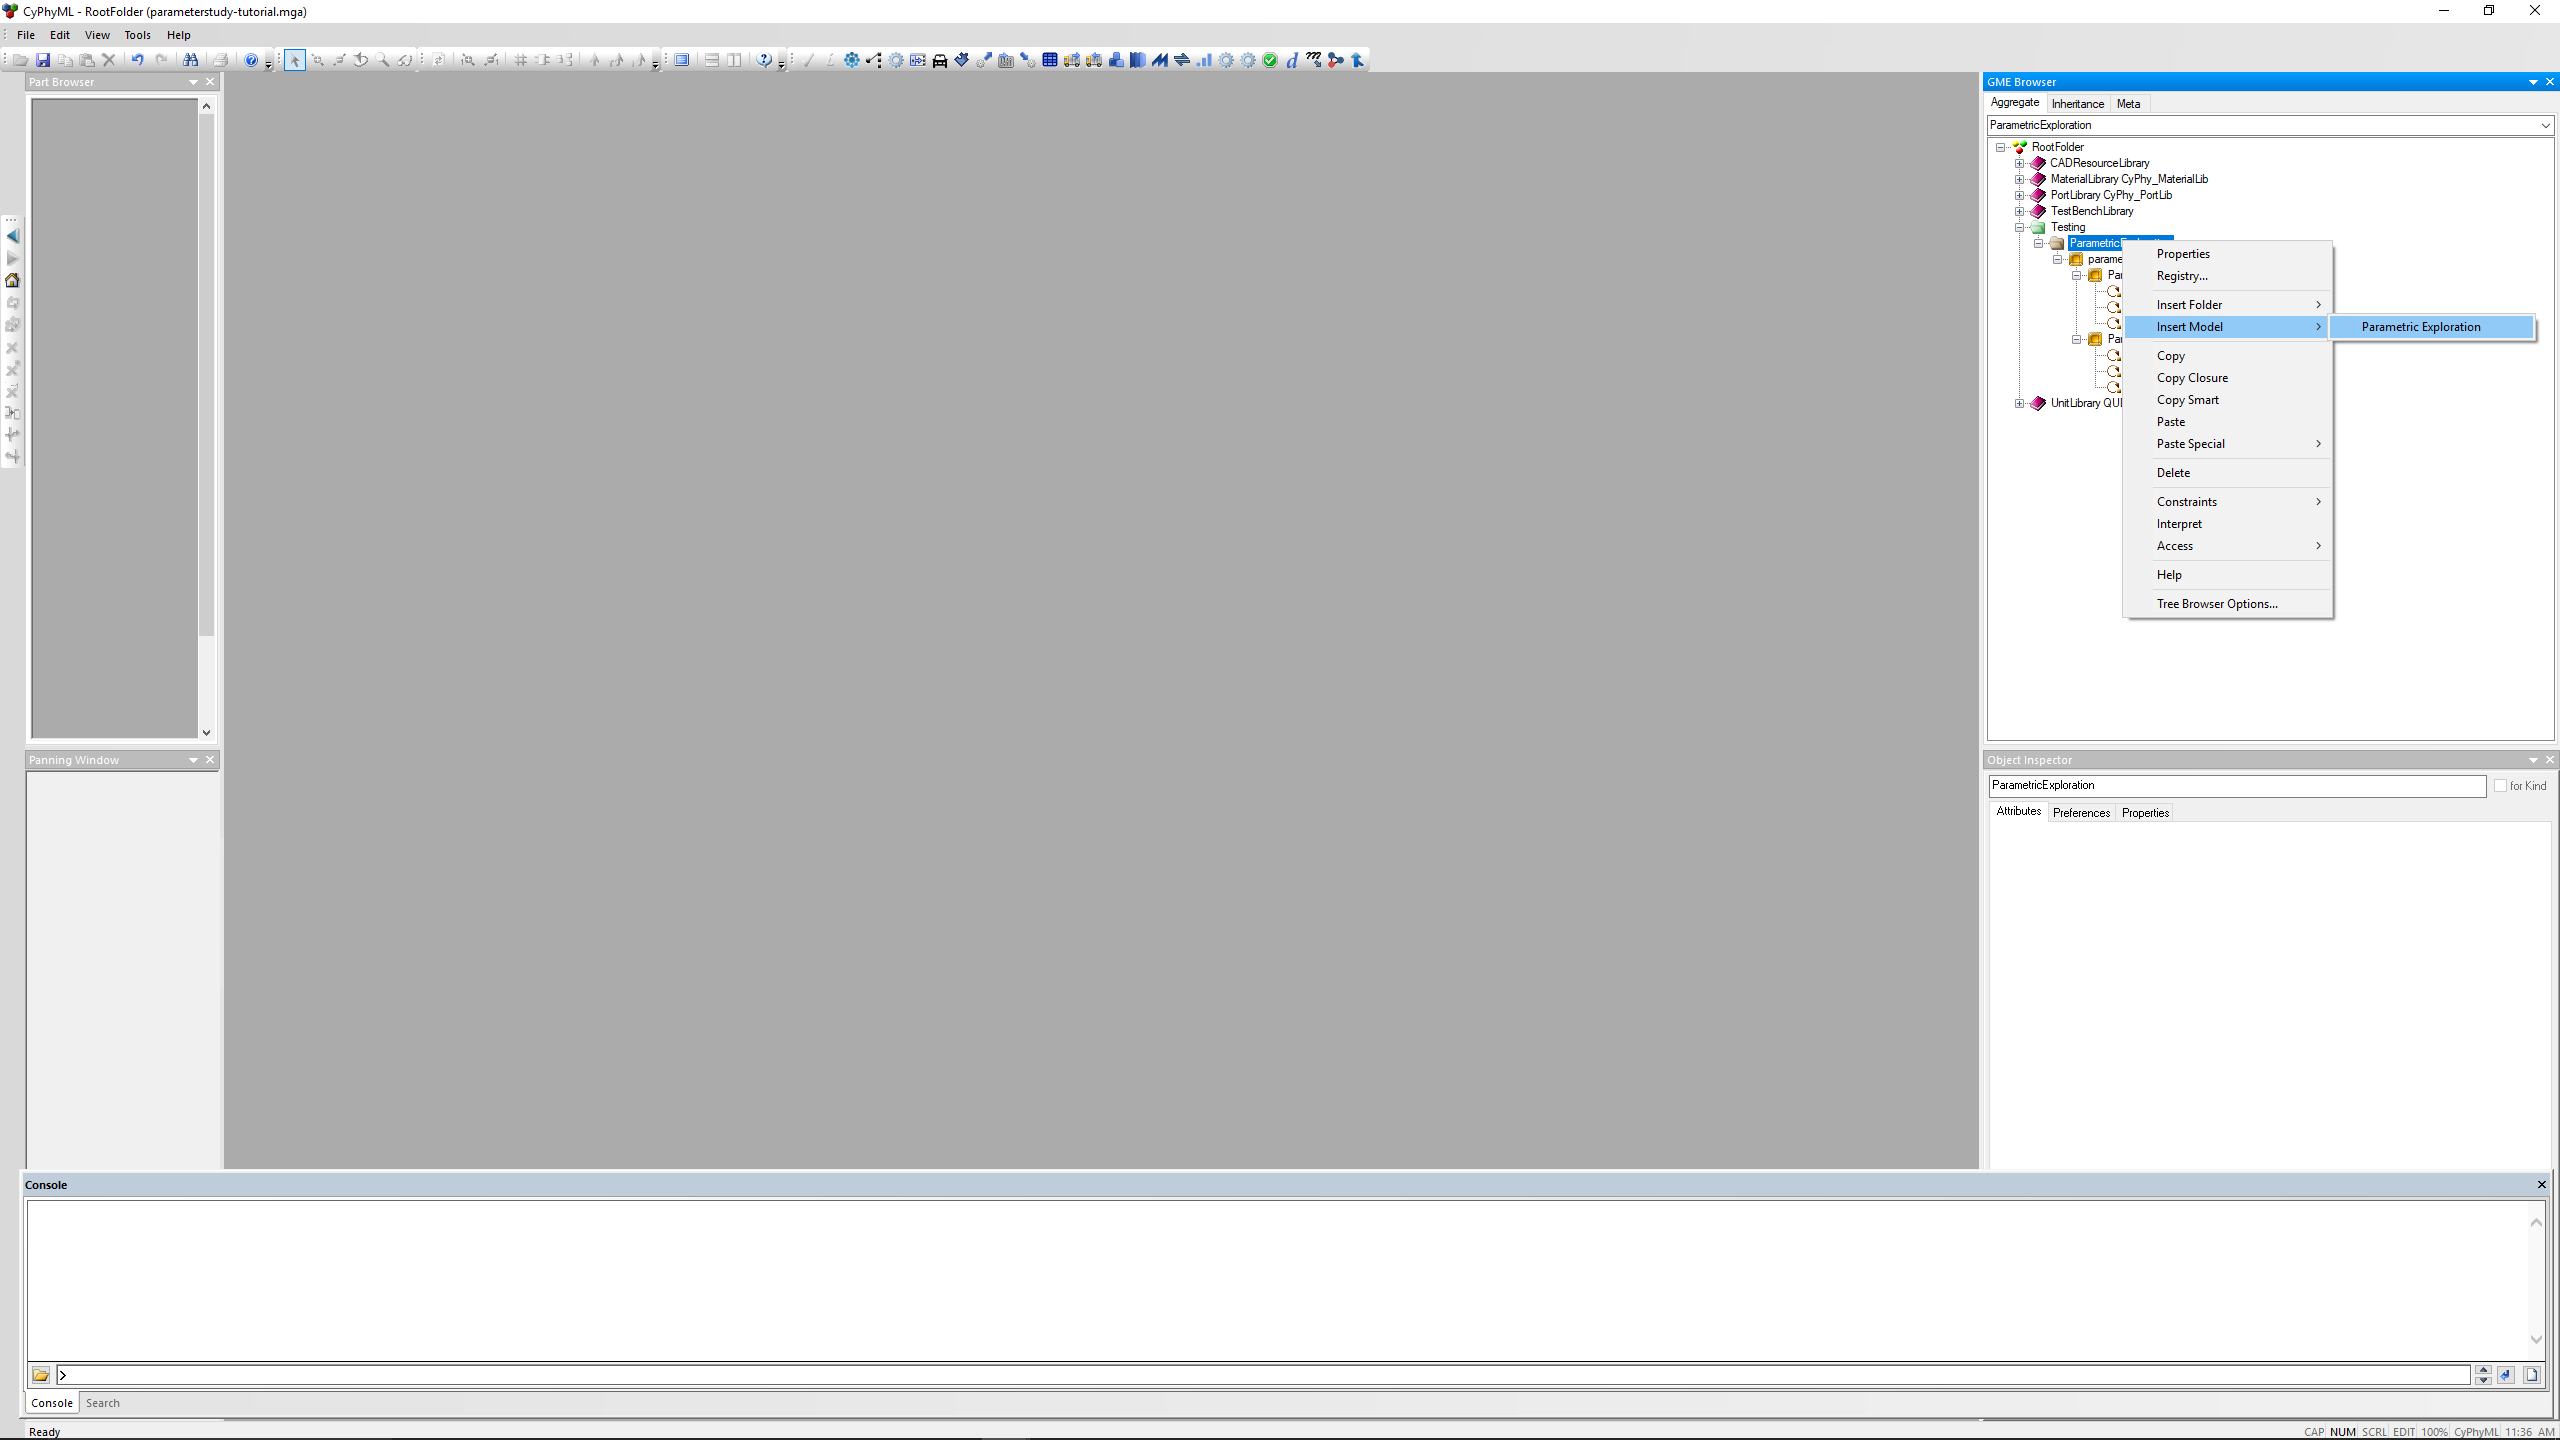
- Inside the GME Browser window, right-click on the folder and select .
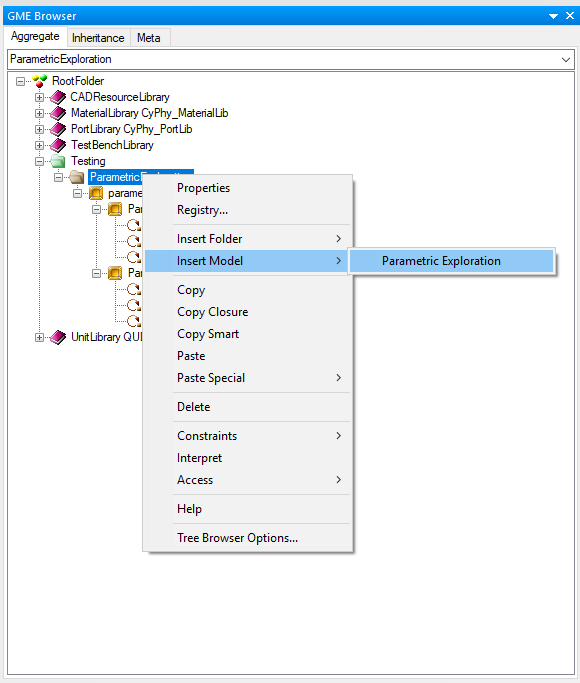
5. Change the name of the newly created ParametricExploration model to “optimizer_tutorial”.
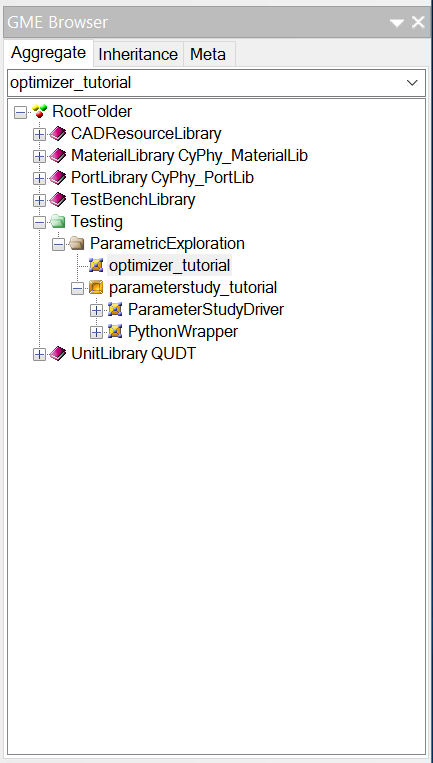
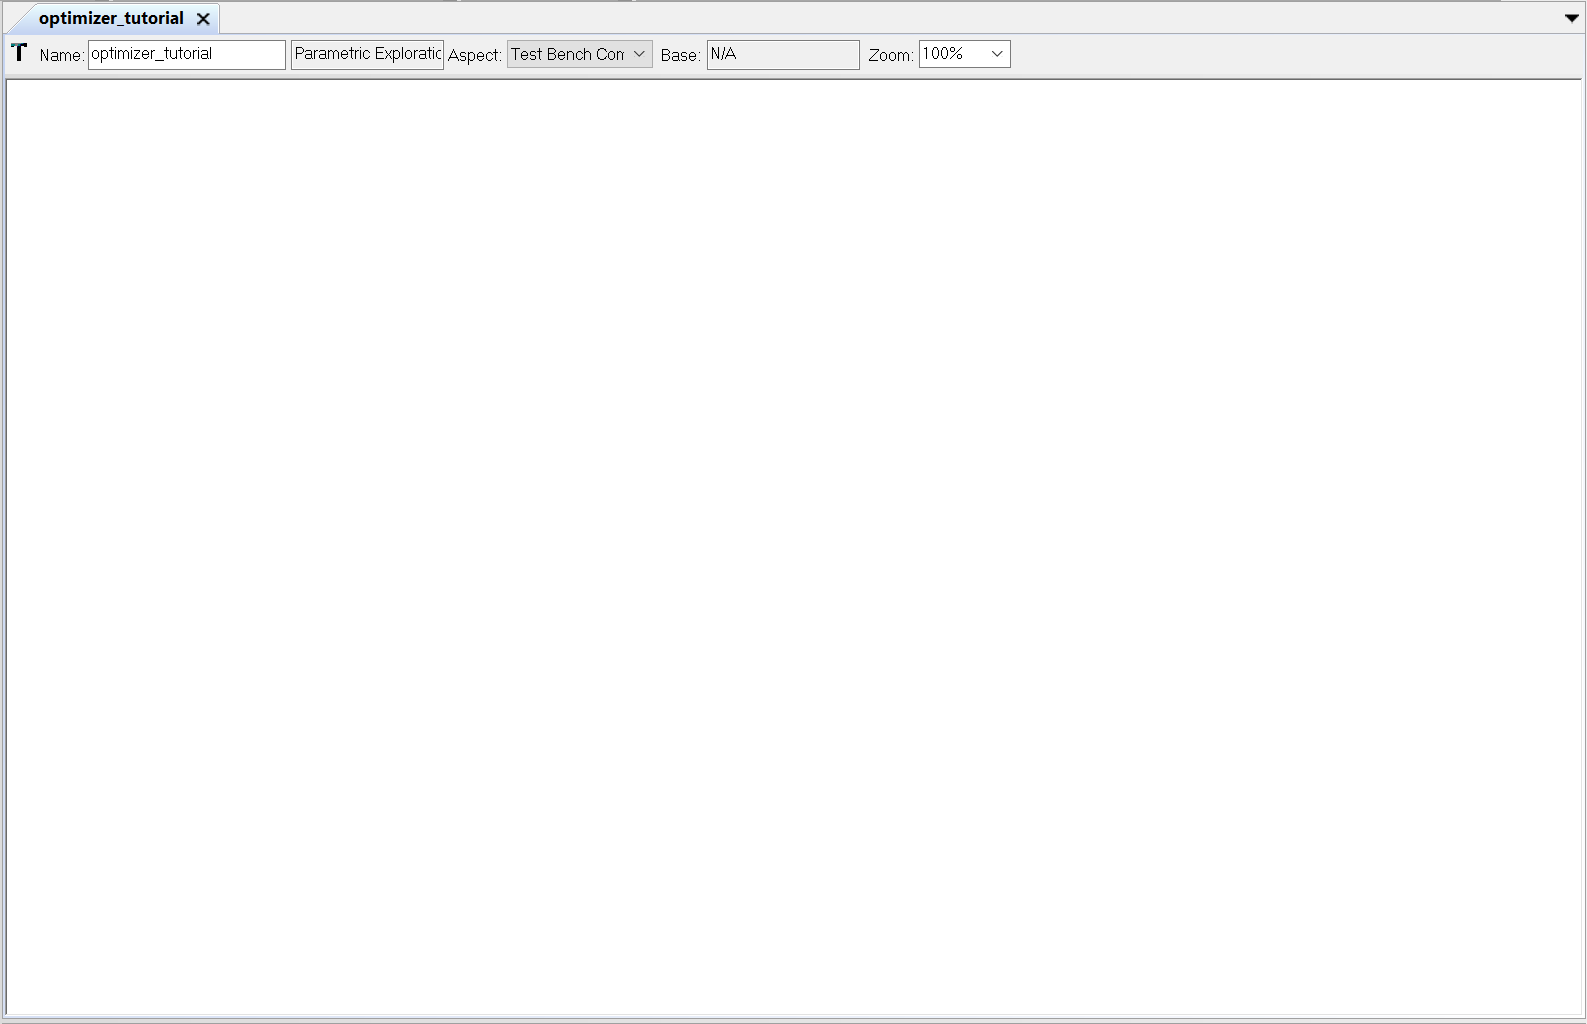
6. Double-click on optimizer_tutorial to open it in the main GME window. It should appear as a blank canvas.
Instead of redoing work, let’s copy our existing work from the Parameter Study tutorial.
7. Inside the GME Browser window, double-click on the to open it in a window.
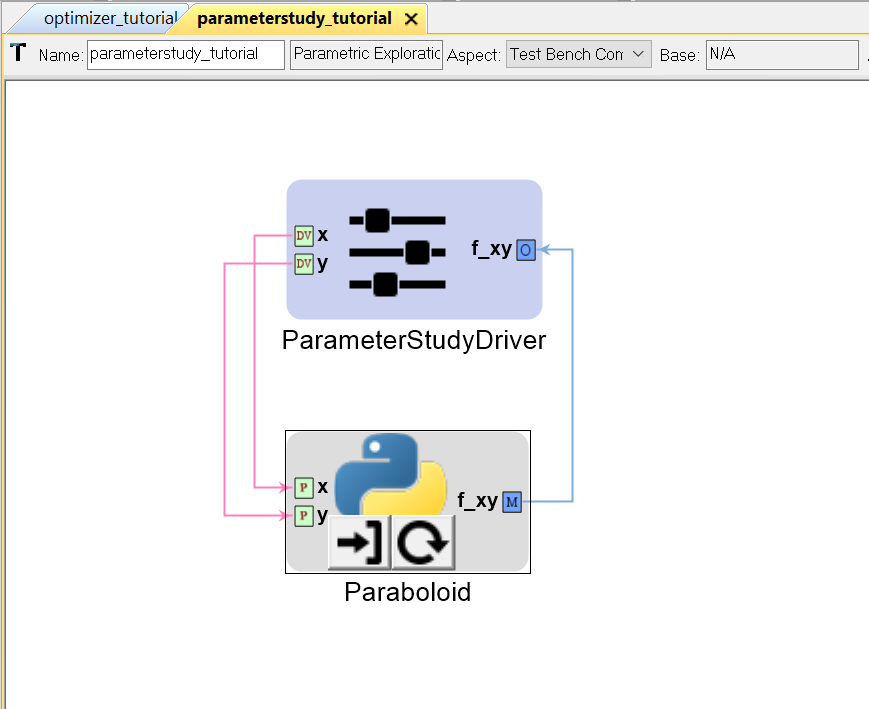
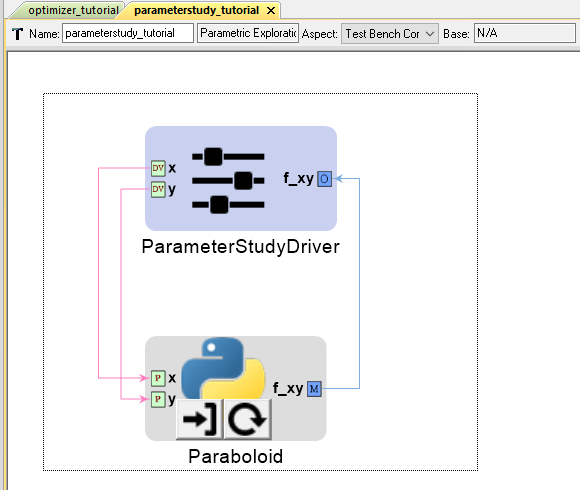
- Left-click and drag within parameterstudy_tutorial’s canvas to select everything.
- Press
(Control-C)to copy the selected area.
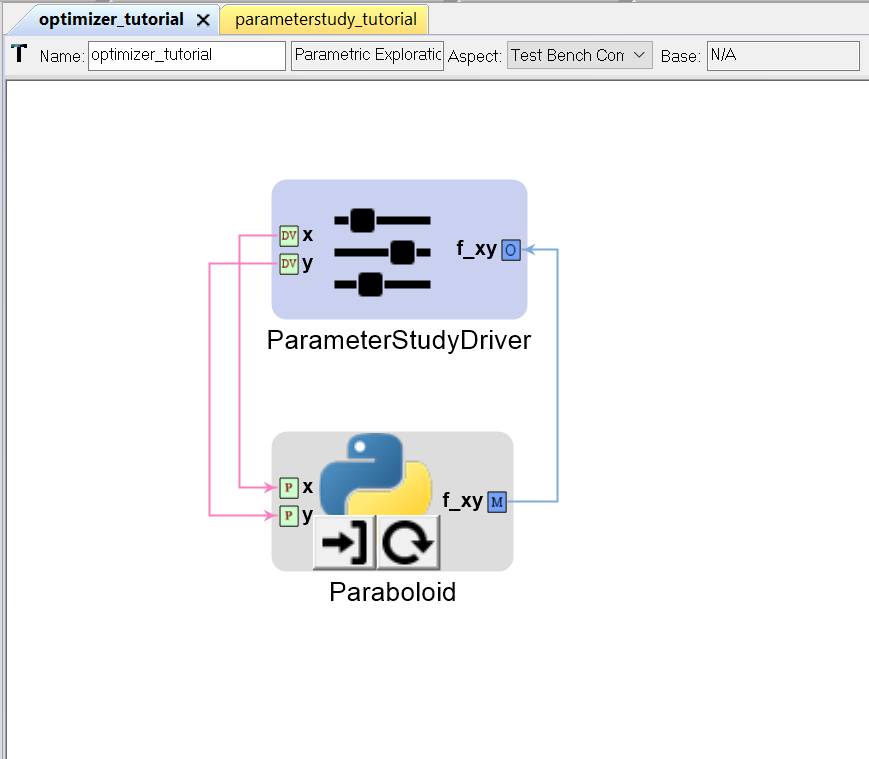
10. Return to the optimizer_tutorial canvas and press (Control-V)
to paste ParameterStudy and Paraboloid into optimizer_tutorial.
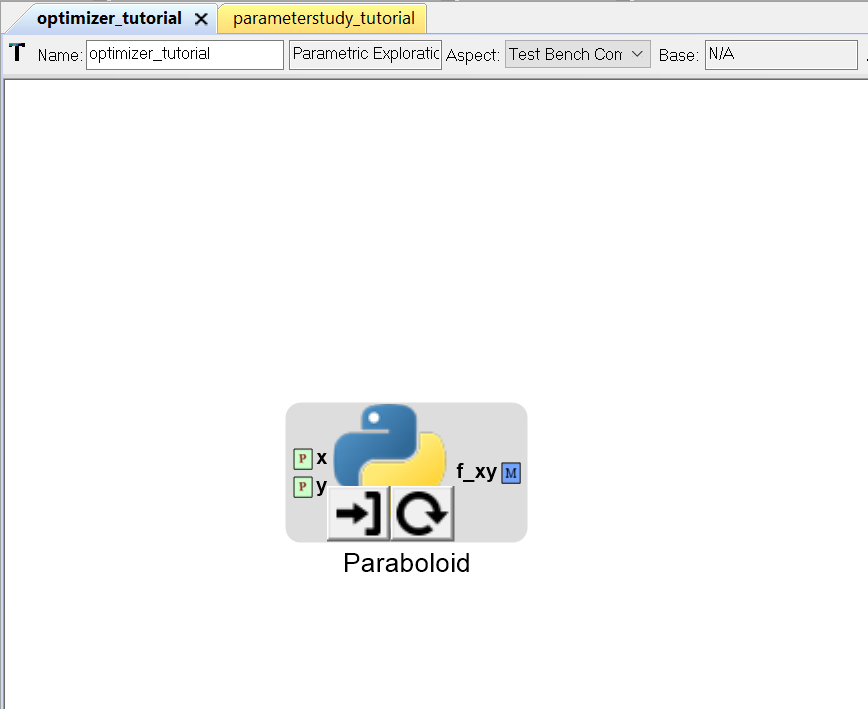
Now, we don’t actually need ParameterStudy since the plan is to use an Optimizer driver instead.
- Left-click on ParameterStudy and press
(Delete).
Adding an Optimizer Driver to the PET
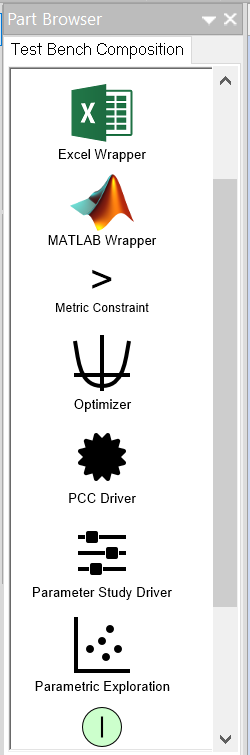
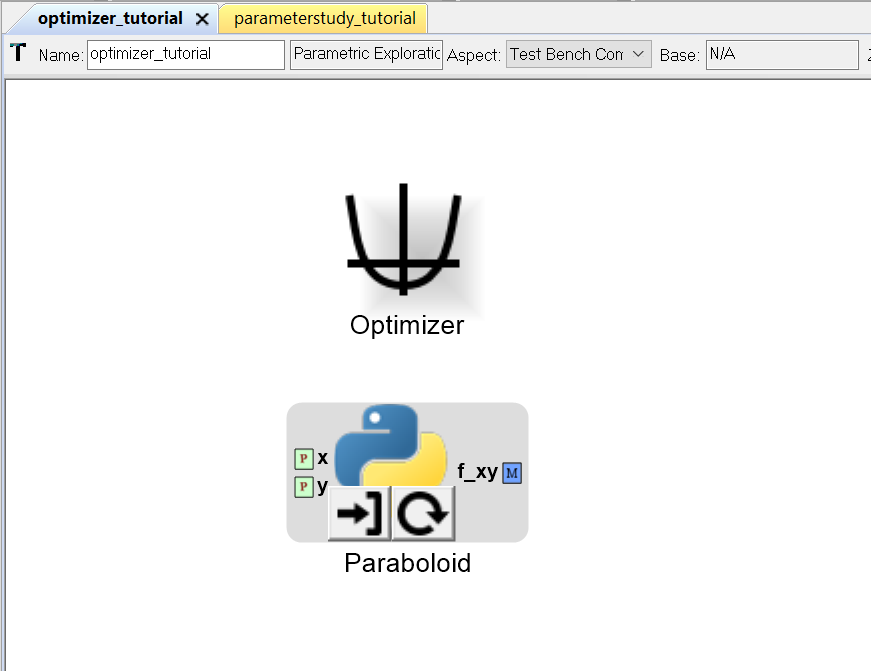
- Left-click on the Optimizer icon in the Part Browser and drag it onto the PET canvas.
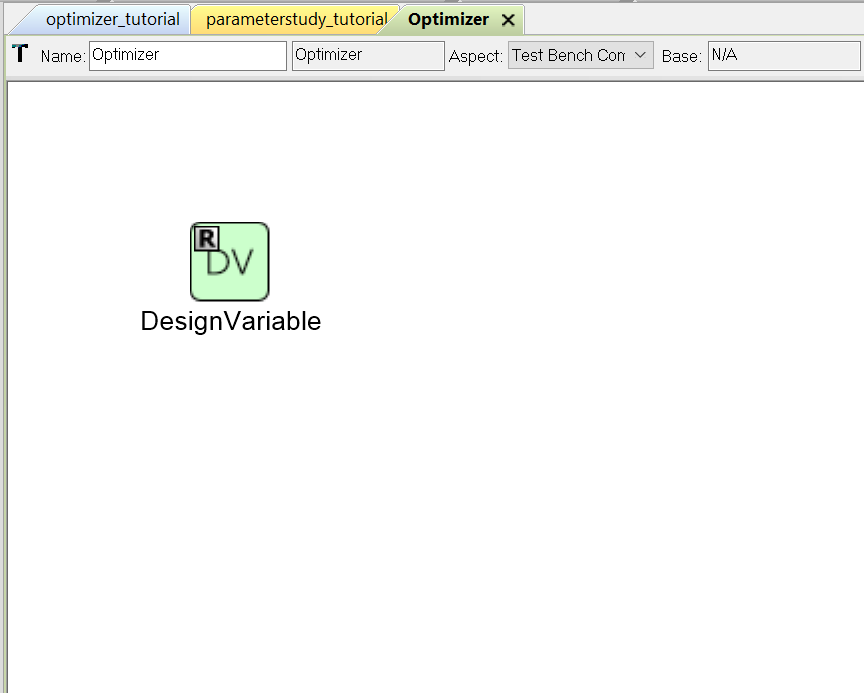
- Double-click on the Optimizer model.
A window with a blank canvas will open up.

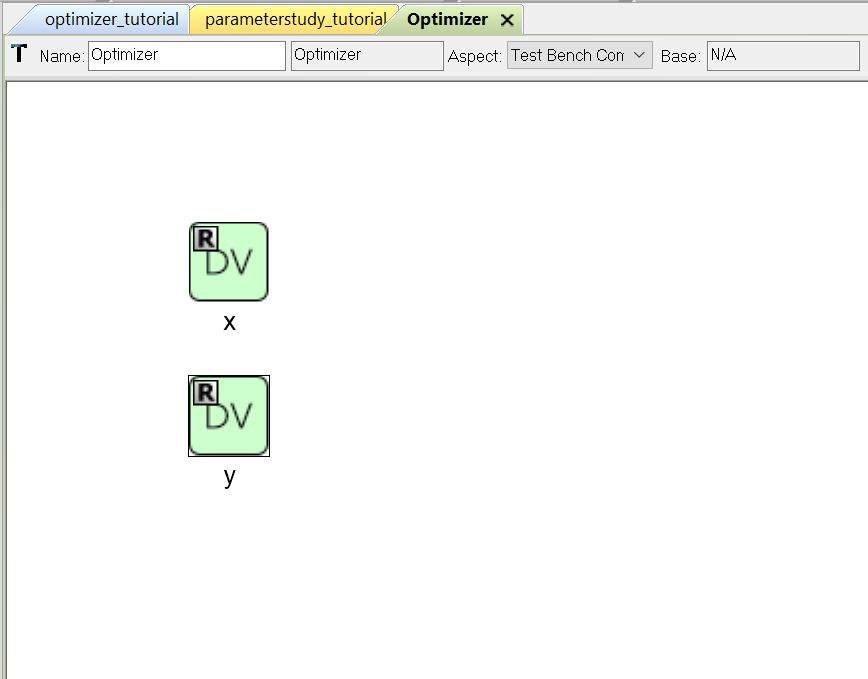
14. Left-click on the Design Variable icon in the Part Browser and drag it onto the Optimizer canvas.
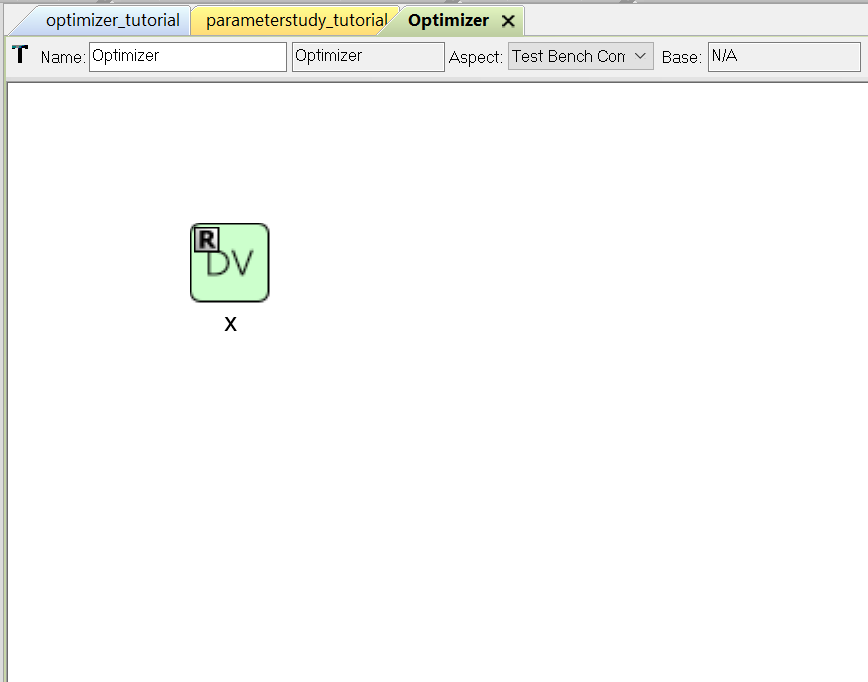
- Left-click the newly added DesignVariable to select it.
- Left-click on the “DesignVariable” label and change it to “x”.
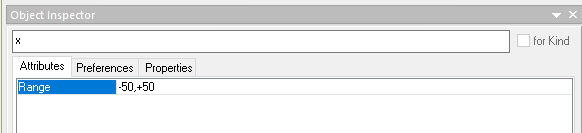
- Left-click on the Design Variable x to select it.
- Locate the Range field under Attributes in the Object Inspector window.
- Set x’s range by entering “-50,+50” in the Range field.
- Repeat Steps 14-19 to add a second Design Variable y with a range of -50,+50 as well.
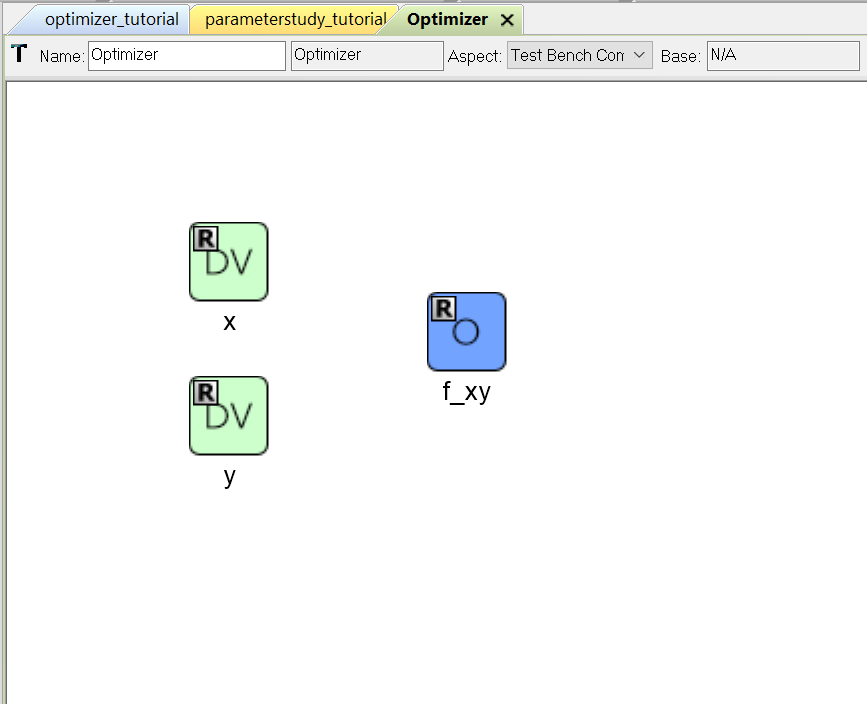
- Left-click on the Objective icon in the Part Browser and drag it onto the Optimizer canvas.
- Change Objectives’s name to “f_xy”.
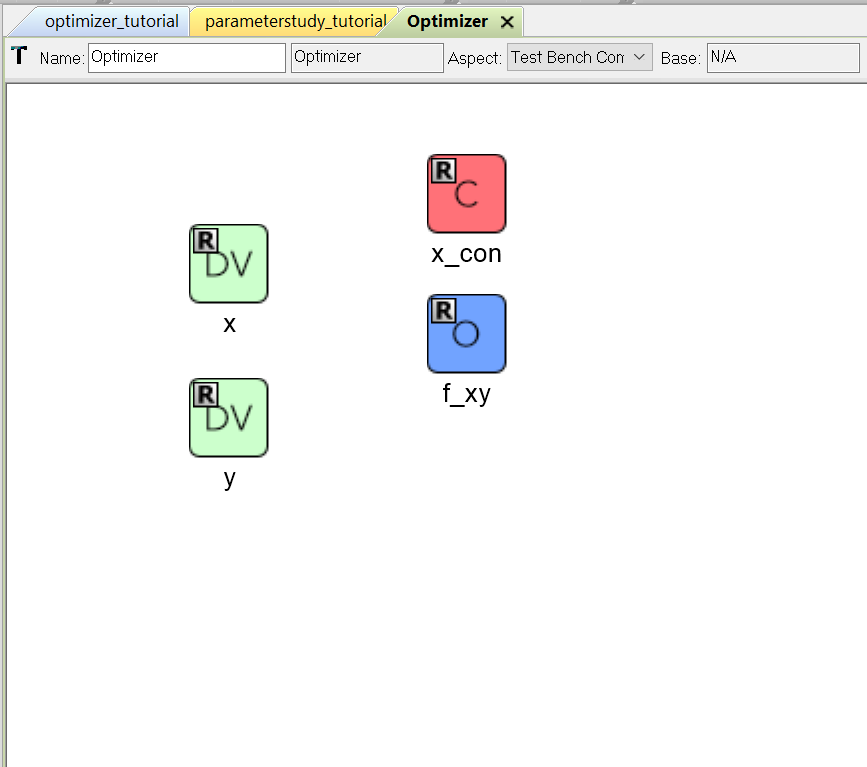
- Left-click on the Optimizer Constraint icon in the Part Browser and drag it onto the Optimizer canvas.
- Change Optimizer Constraint’s name to “x_con”.
- Left-click on the Optimizer Constraint x_con to select it.
- Locate the MaxValue and MinValue fields under Attributes in the Objective Inspector window.
- Enter “+50” and “-50” in MaxValue and MinValue’s respective fields.
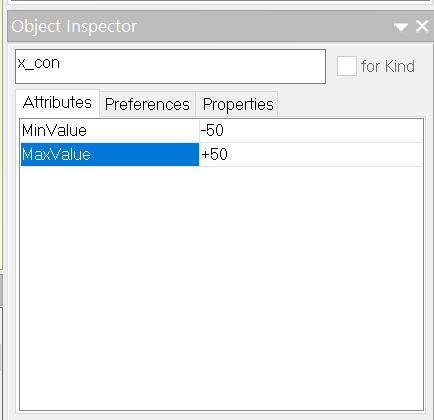
28. Repeat Steps 23-27 to add a second Optimizer Constraint y_con with a MaxValue of +50 and a MinValue of -50.
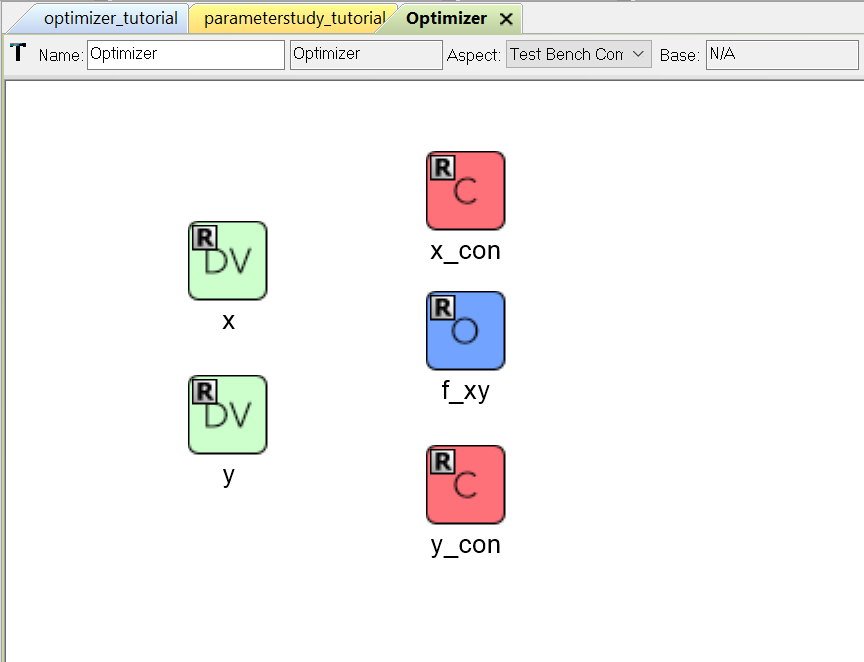
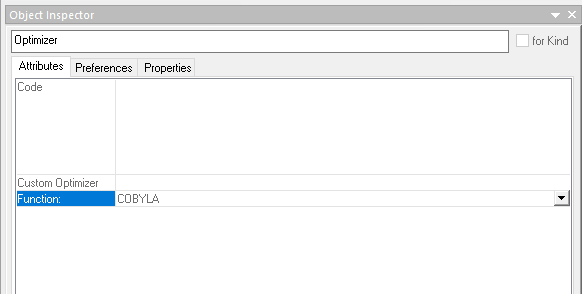
- Left-click on the Optimizer canvas to select it.
- Select COBYLA for the Function field.
Note
COBYLA stands for Constrained Optimization BY Linear Approximation and is the default Optimizer function in OpenMETA since it does not require defined gradients / Jacobian matrices in order to work.
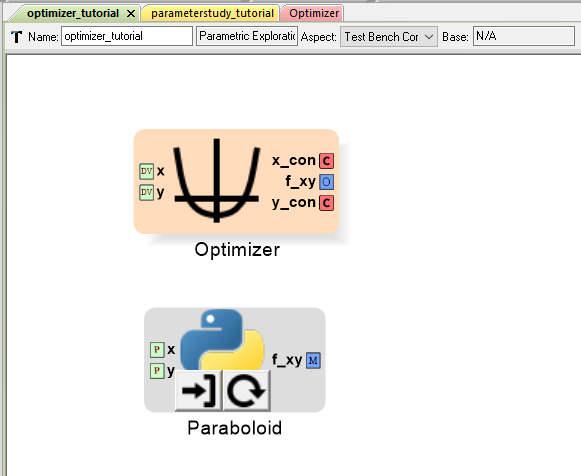
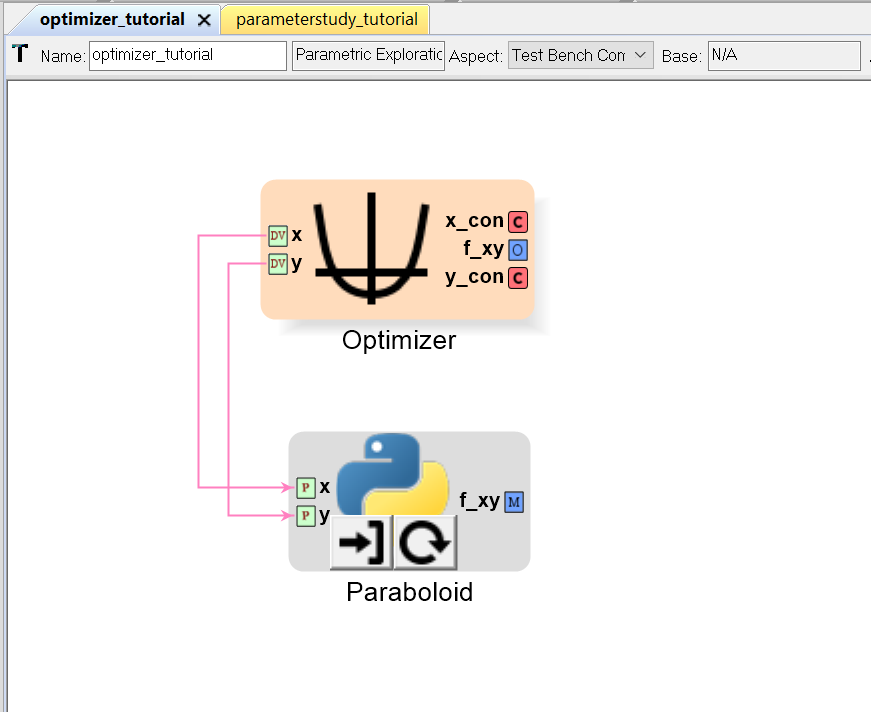
- Open the optimizer_tutorial window
Notice that Design Variables x and y, Optimizer Constraints x_con and y_con, and the Objective f_xy are now exposed as ports on the outside of the Optimizer model.
Making connections within the PET
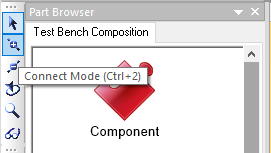
- Left-click the Connect Mode icon on the Modeling toolbar.
33. Using Connect Mode, connect Optimizer’s Design Variables x and y to Paraboloid’s Parameters x and y.
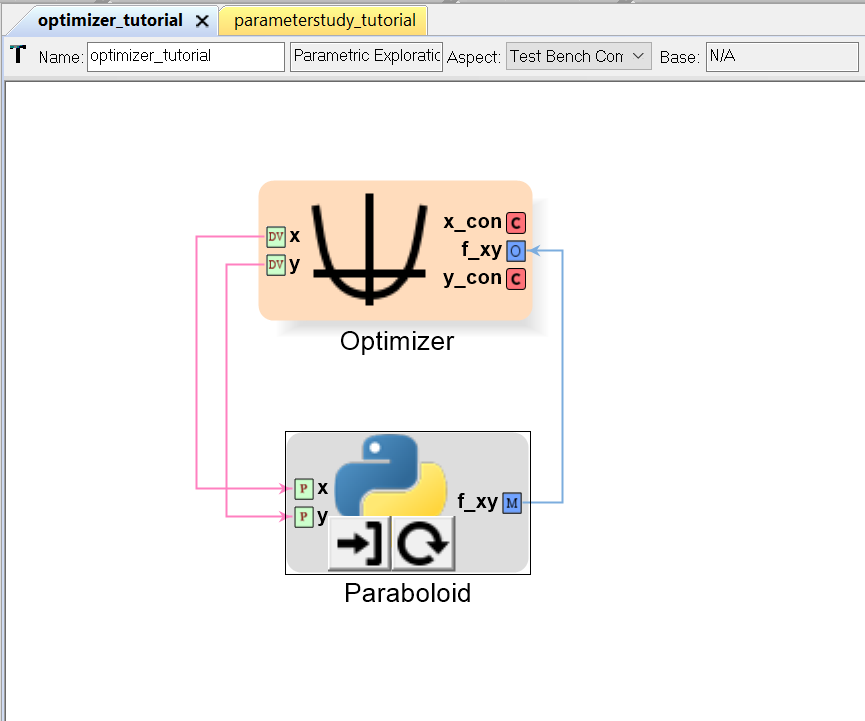
34. Connect Paraboloid’s Metric f_xy to Optimizer’s Objective f_xy.
35. Connect Optimizer’s Design Variables x and y to Optimizer’s Optimizer Constraints x_con and y_con.
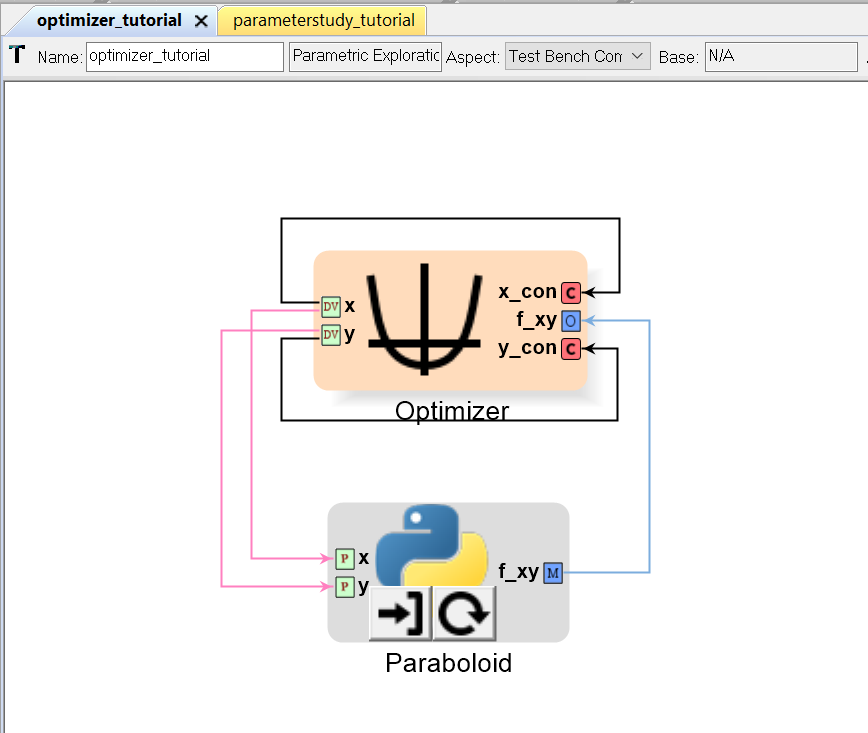
Now everything is connected!
Running a PET Analysis
Now that the PET has been set up, it is time to run it.
- Left-click on the CyPhy Master Interpreter icon on the Components toolbar.
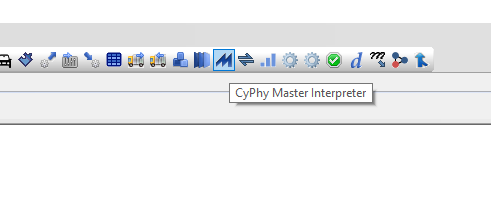
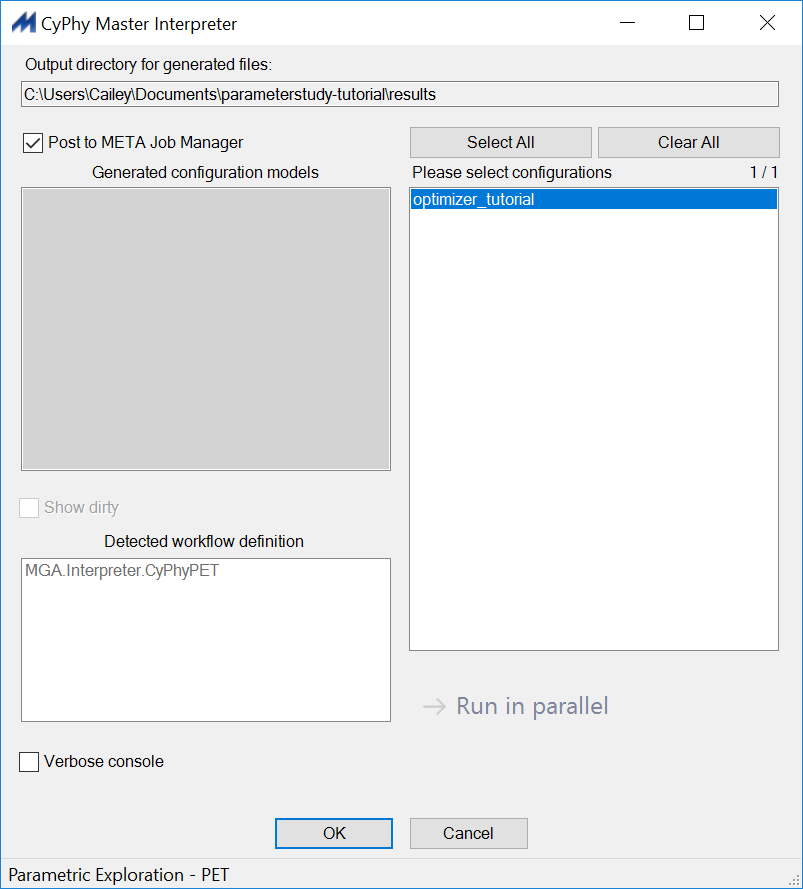
The CyPhy Master Interpreter window will open up.
- Make sure the Post to META Job Manager checkbox is selected.
- Select OK.
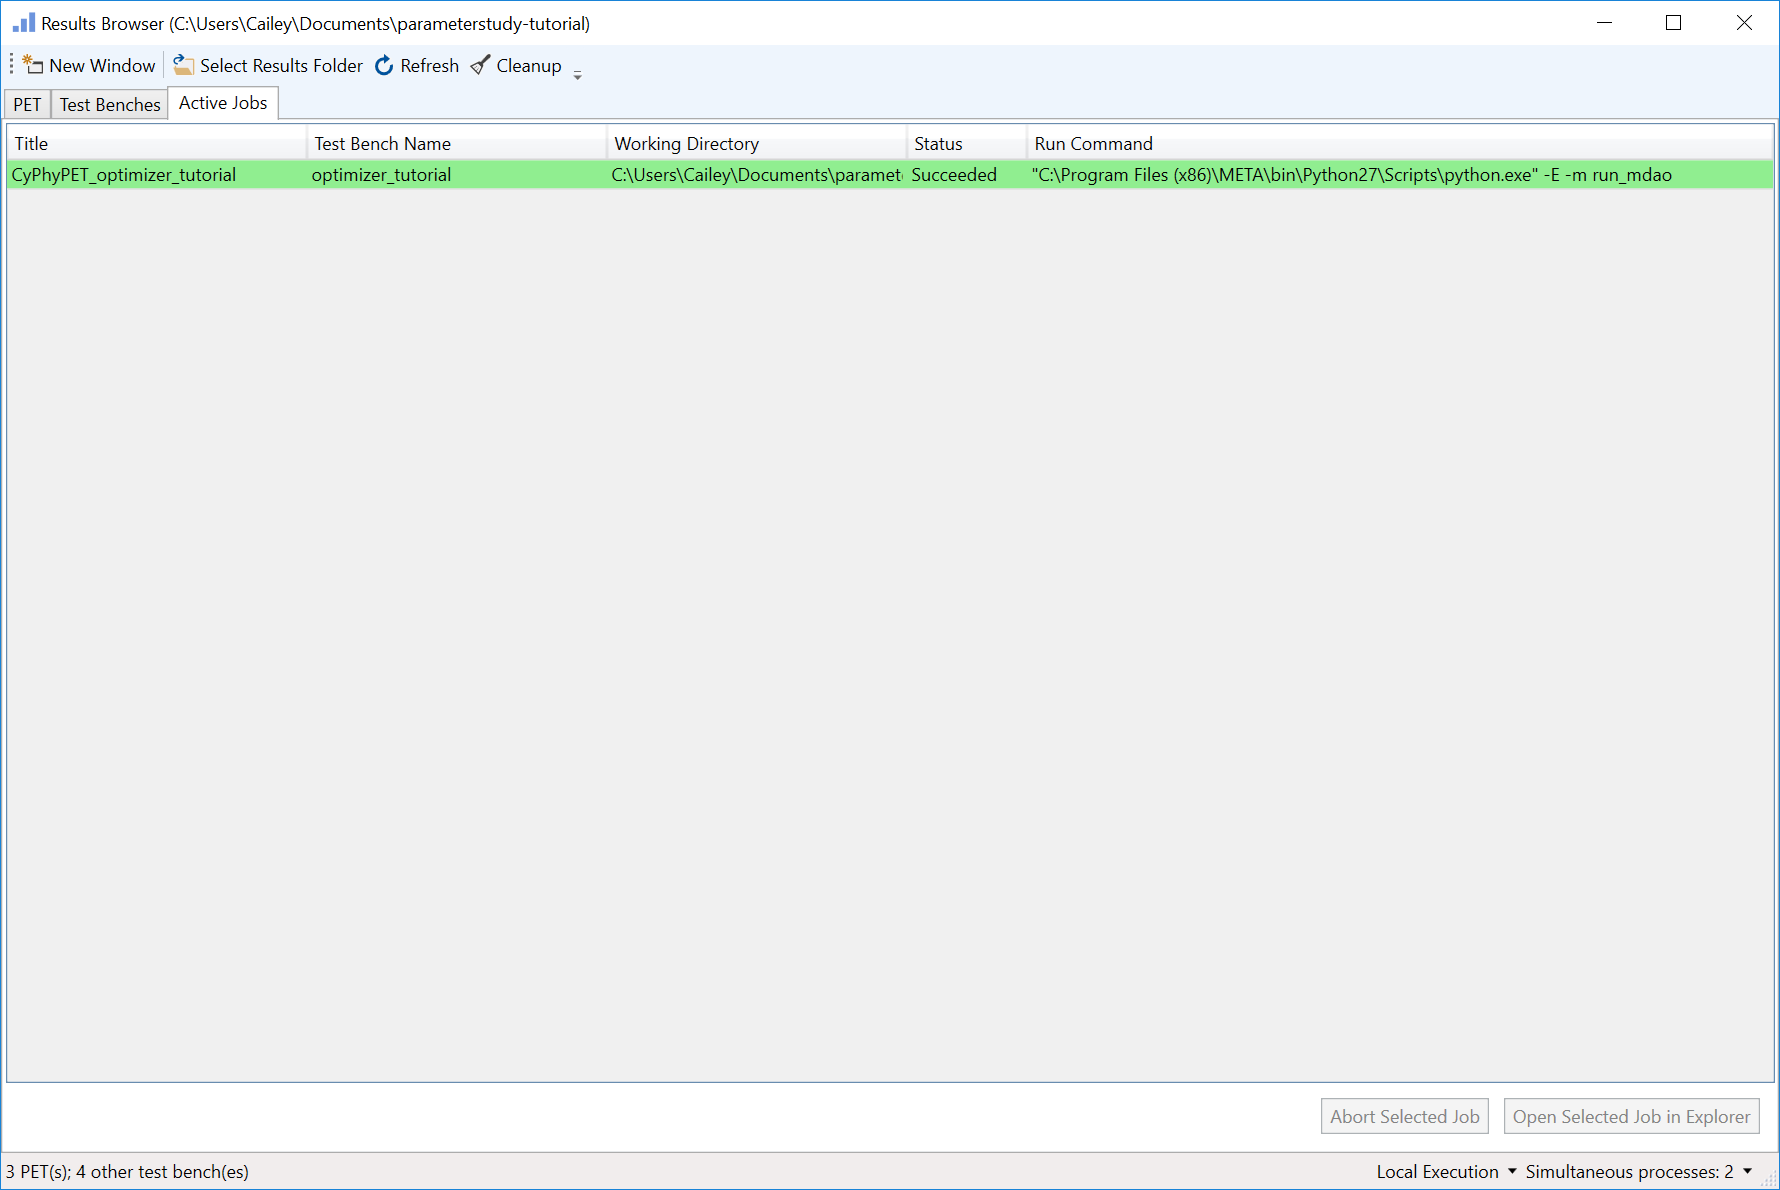
The Results Browser will open up.
- Left-click on the PET tab within the Results Browser.
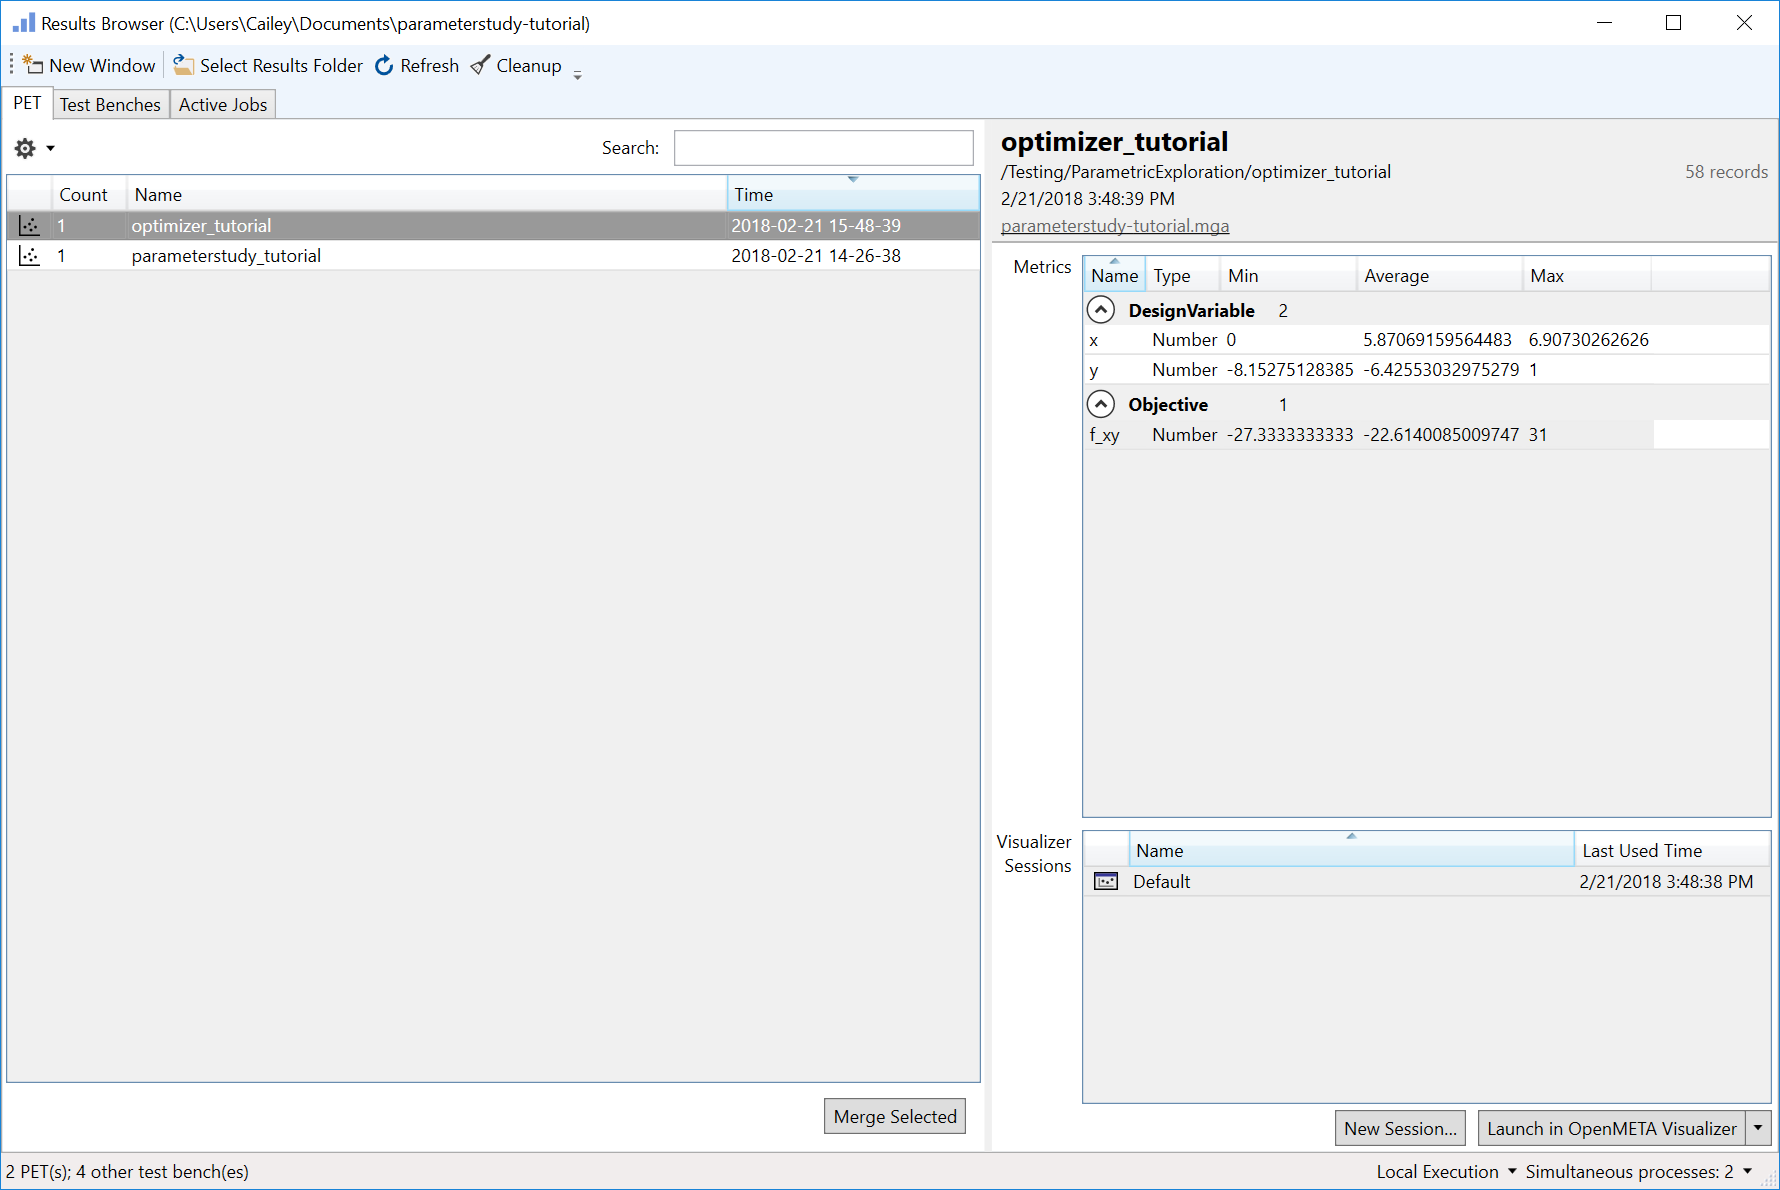
- Left-click optimizer_tutorial to display run information on the right pane.
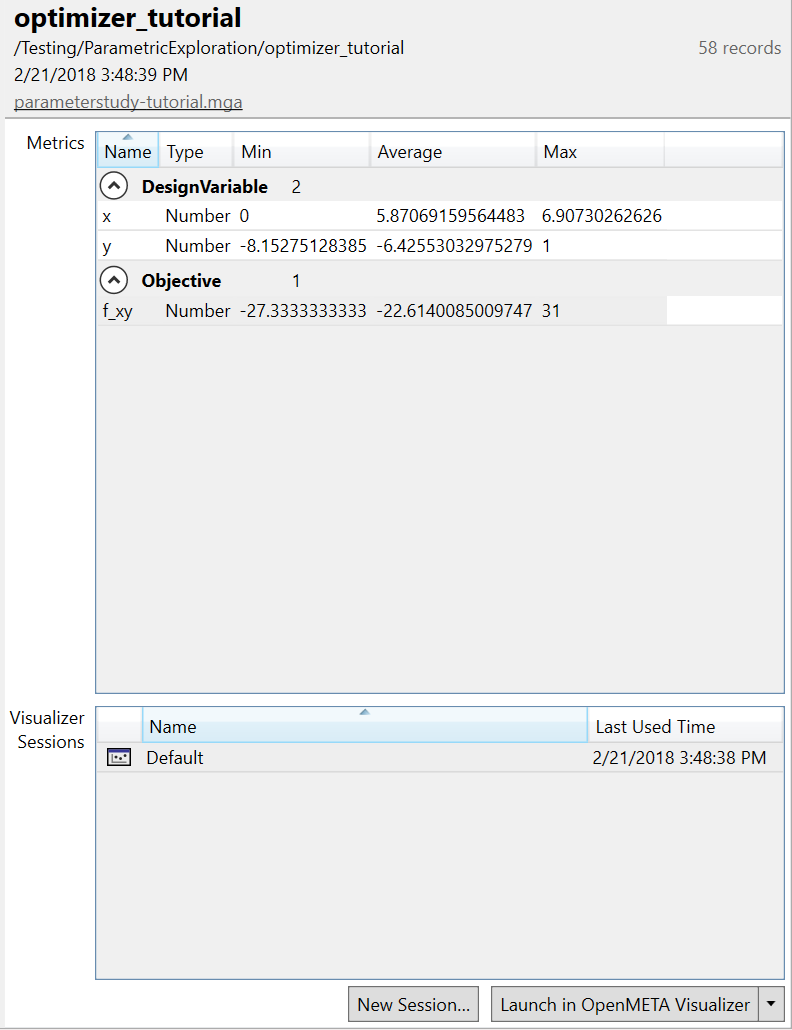
You will notice that optimizer_tutorial generated 58 records, meaning that it converged in 58 iterations. As you can see it discovered the correct global minimum of f_xy at value of -27.33.
Compared to parameterstudy_tutorial, optimizer_tutorial found f_xy’s minimum much more efficiently and accurately.
Note
The (dis)advantage of using an Optimizer Driver is that it will not explore nearly as much of the design space as a Parameter Study Driver will.
Visualizer Analysis
41. Left-click Launch in OpenMETA Visualizer in the bottom-right corner of the Results Browser.
A browser window will open with the Visualizer.
- Navigate to the Pairs Plot tab of the Explore tab.
- Clear the default contents of the Design Variables: field in the Variables section.
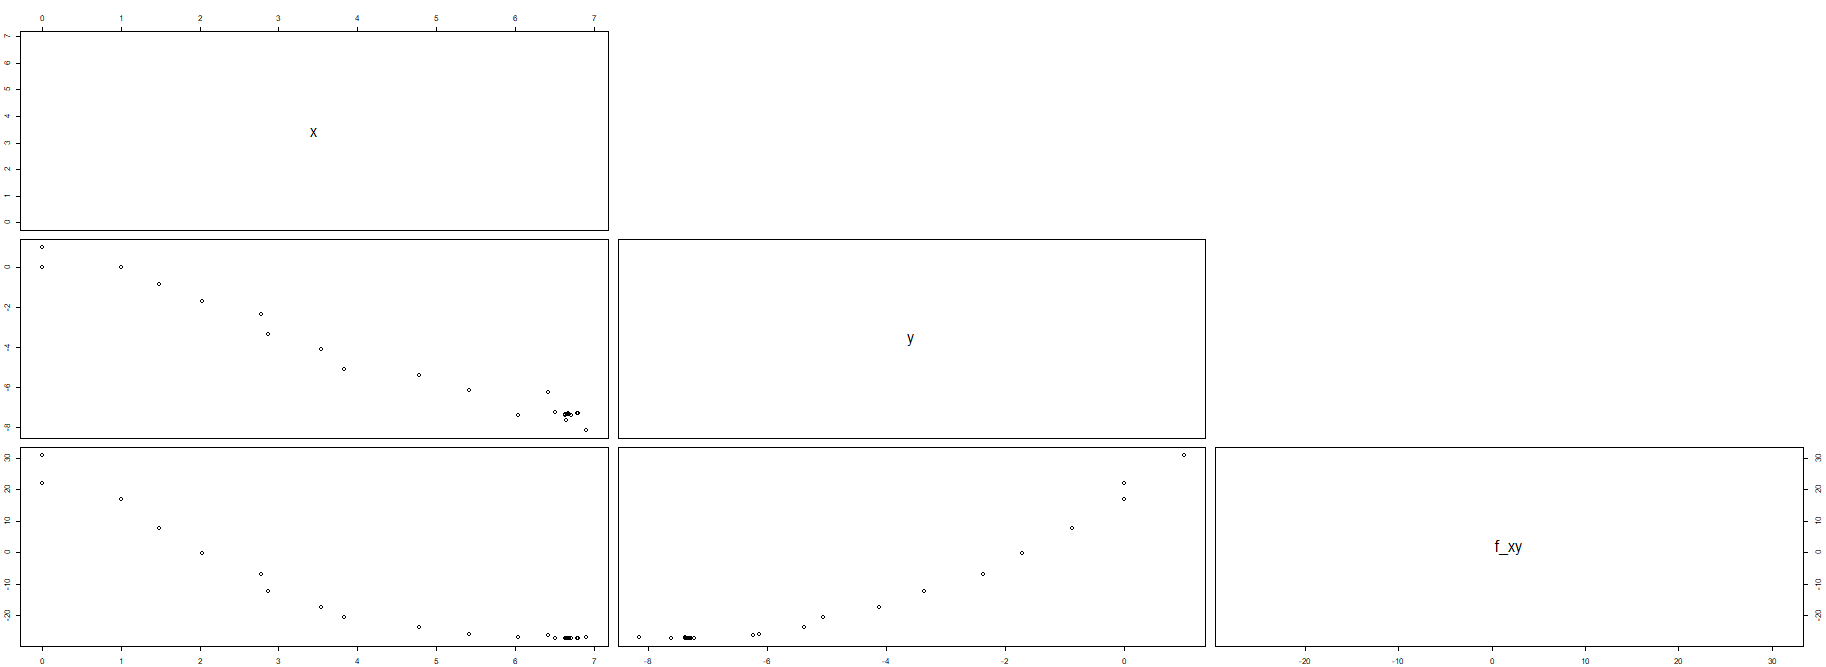
- Add x, y, and f_xy to the Design Variables: field.
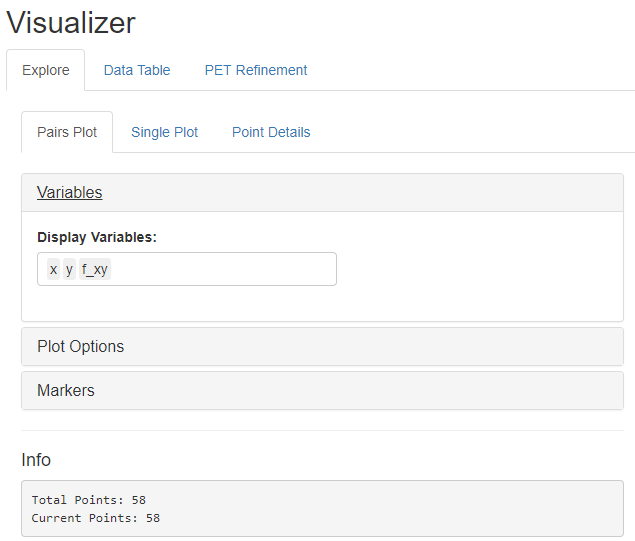
The graphs show how x and y had their values changed by the Optimizer Driver as f_xy’s value was minimized.
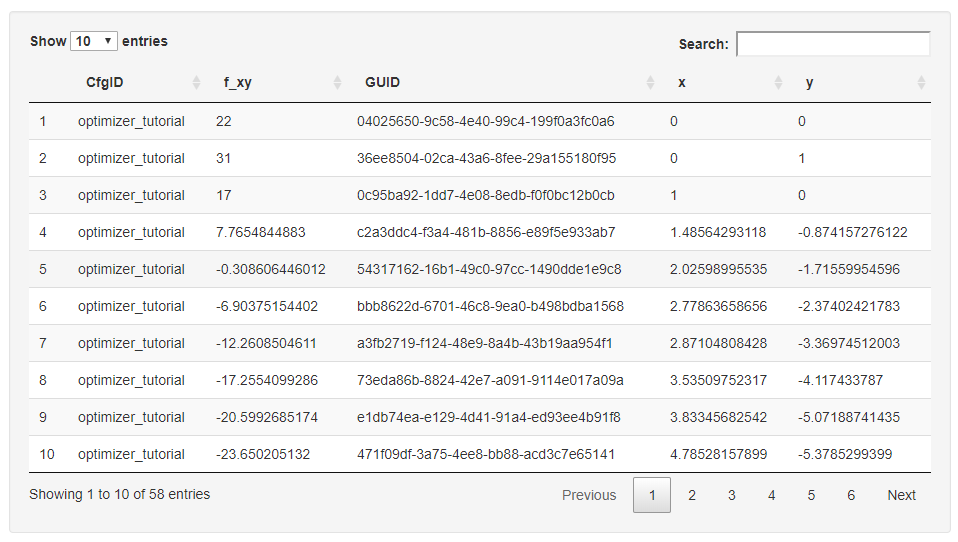
- Left-click on the Data Table tab of the Visualizer.
This will display the result records in a table format.
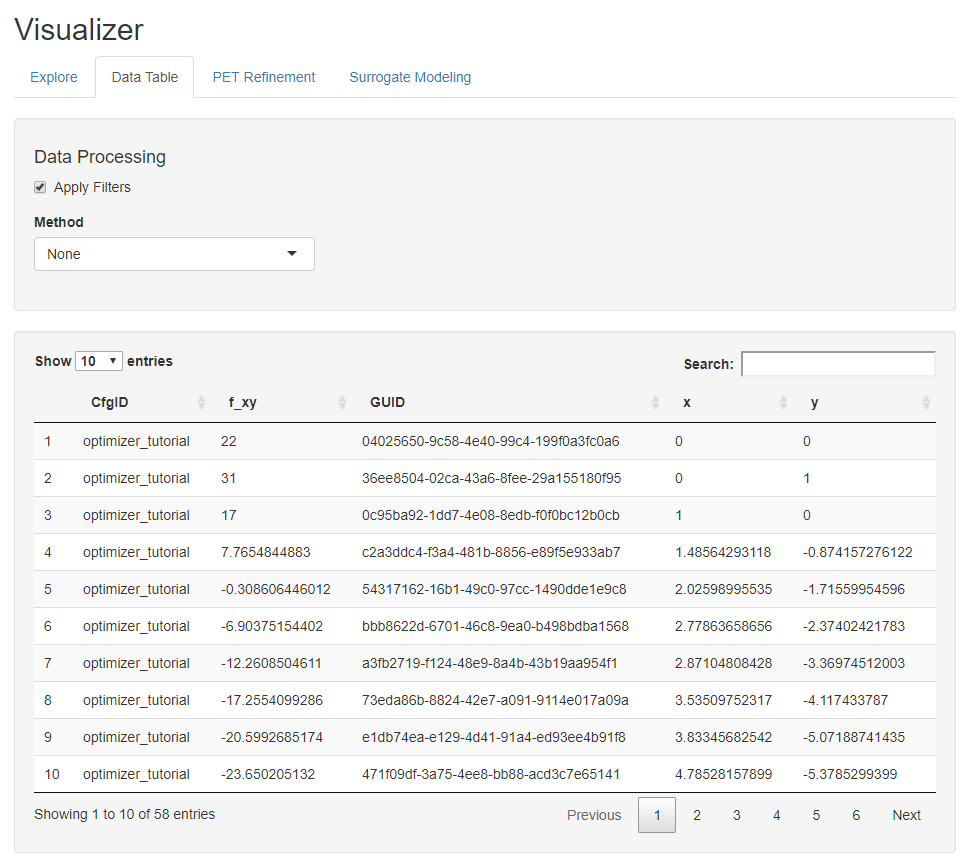
By default, the results are sorted in ascending order by iteration.
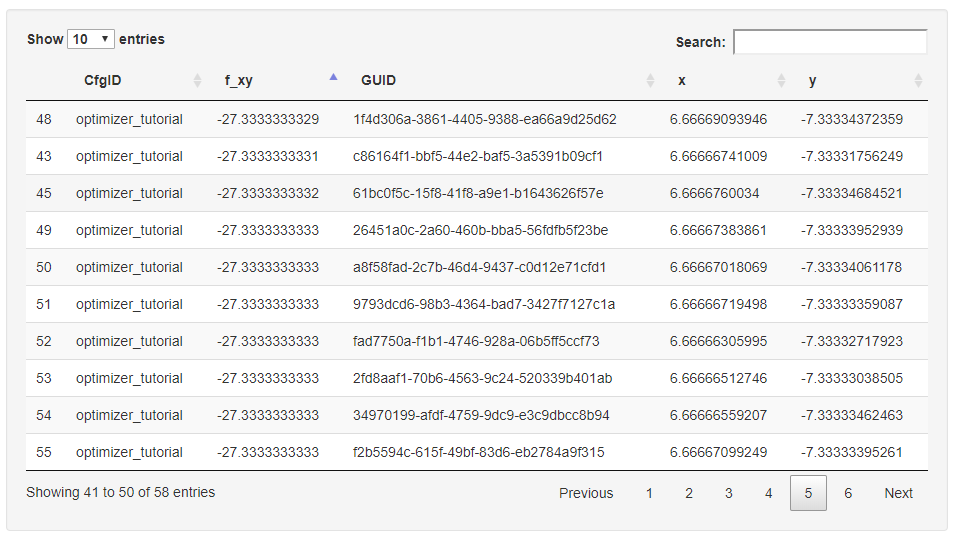
- Left-click on the f_xy column header to sort the results in ascending order.
The Optimizer found a minimum value of -27.33 for f_xy at x = 6.67 and y = -7.33.
Congratulations! You have successfully completed the PET Tutorial.
For more information on PETs, Analysis Blocks, and Drivers, check out the Parametric Exploration Tool (PET) chapter of the OpenMETA Documentation.
For more information on the Optimizer PET Driver specifically, check out the Optimizer PET Driver section as well as the Optimization section of Advanced Topics.