Running a PET Analysis
Now that the PET has been set up, we can run it.
1. Left-click on the CyPhy Master Interpreter icon on the Components toolbar.
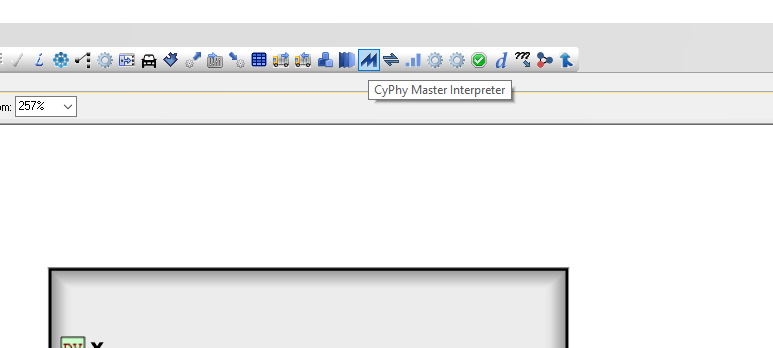
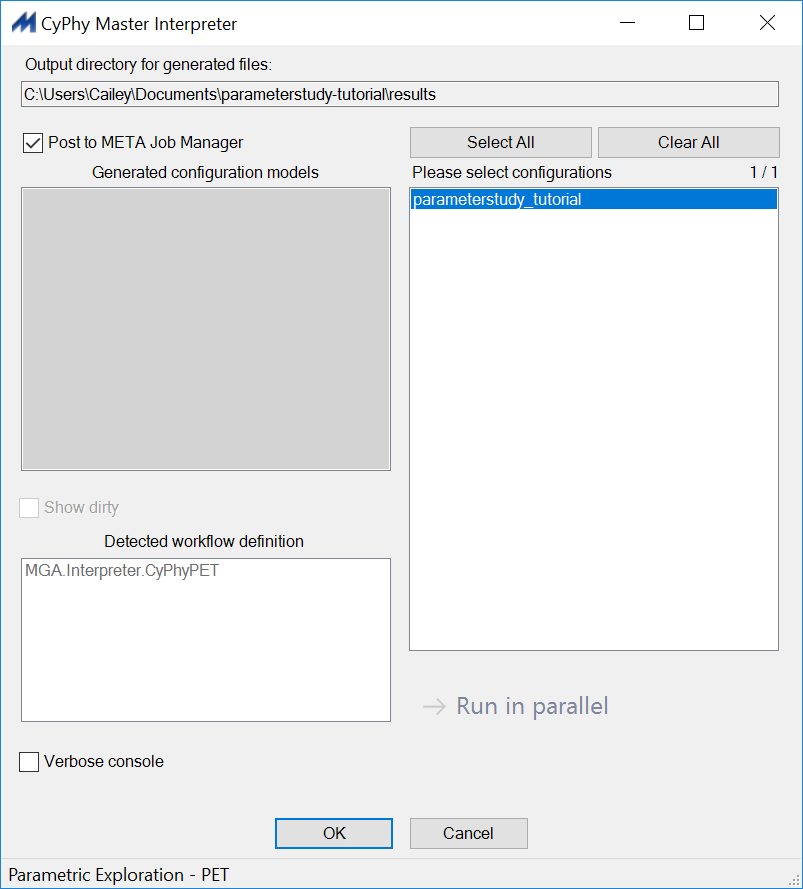
The CyPhy Master Interpreter window will open up.
- Make sure the Post to META Job Manager checkbox is selected.
- Select OK.
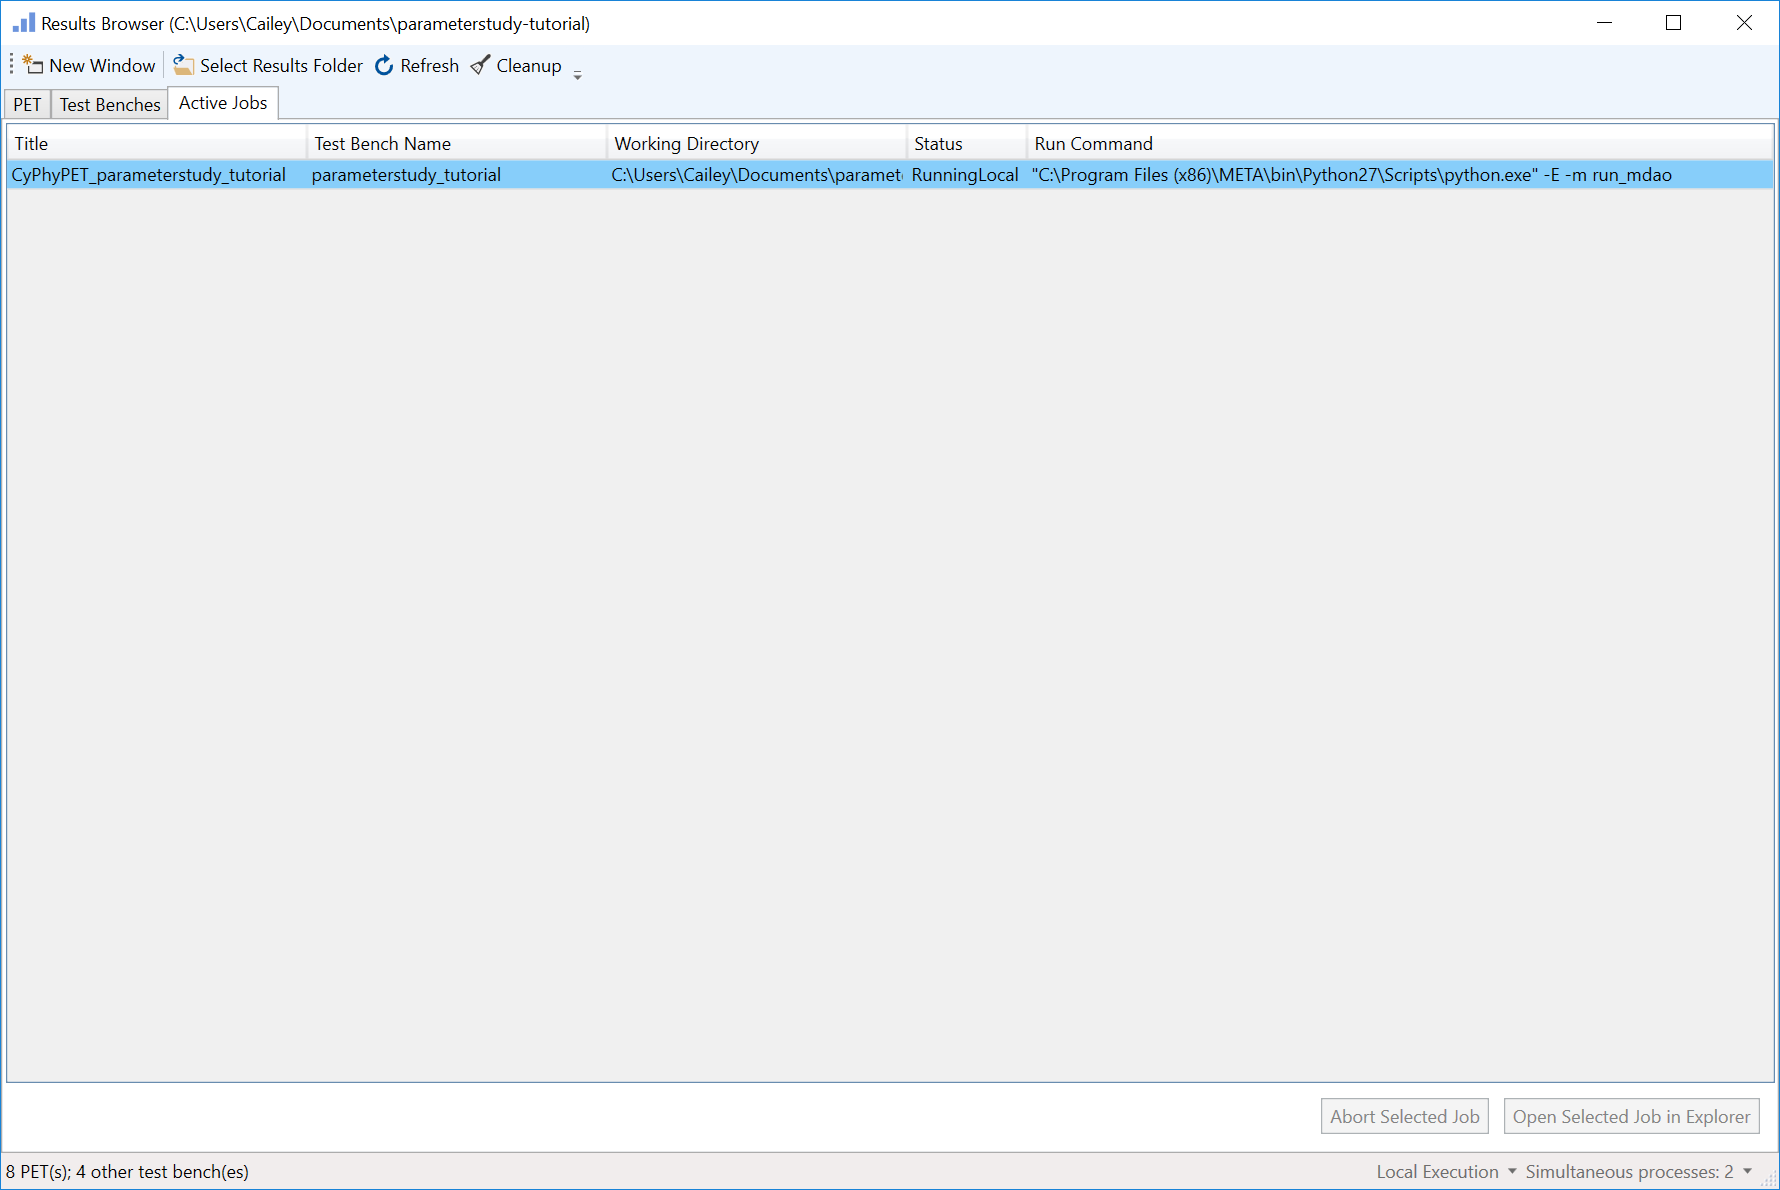
The Results Browser will open up. Our PET is listed under the Active Jobs tab. The Blue shading means that it is running.
When the PET finishes running successfully, its shading will turn green.
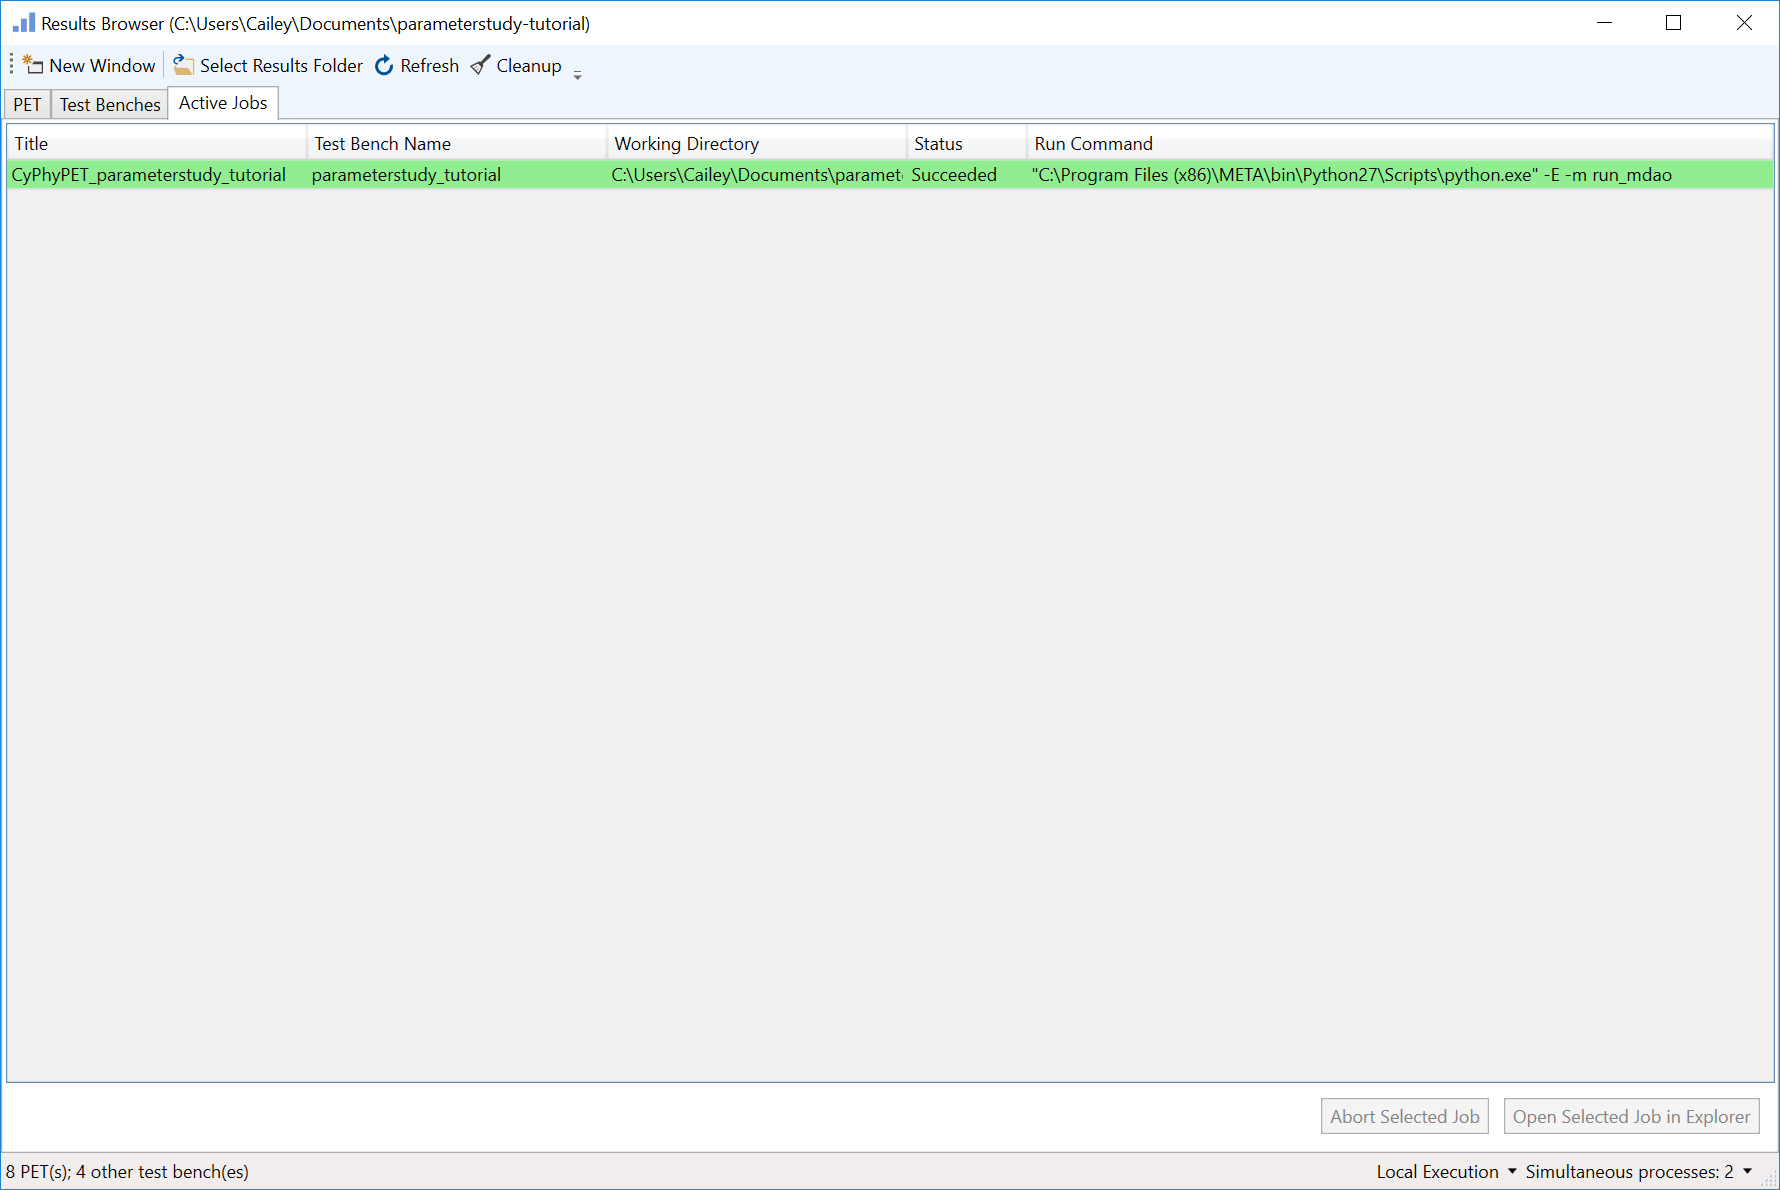
Note
If the shading is red, then the run failed and a _FAILED.txt file with error codes has been generated in the run’s folder. To access this folder, double-click on the job.
- Left-click on the PET tab within the Results Browser.
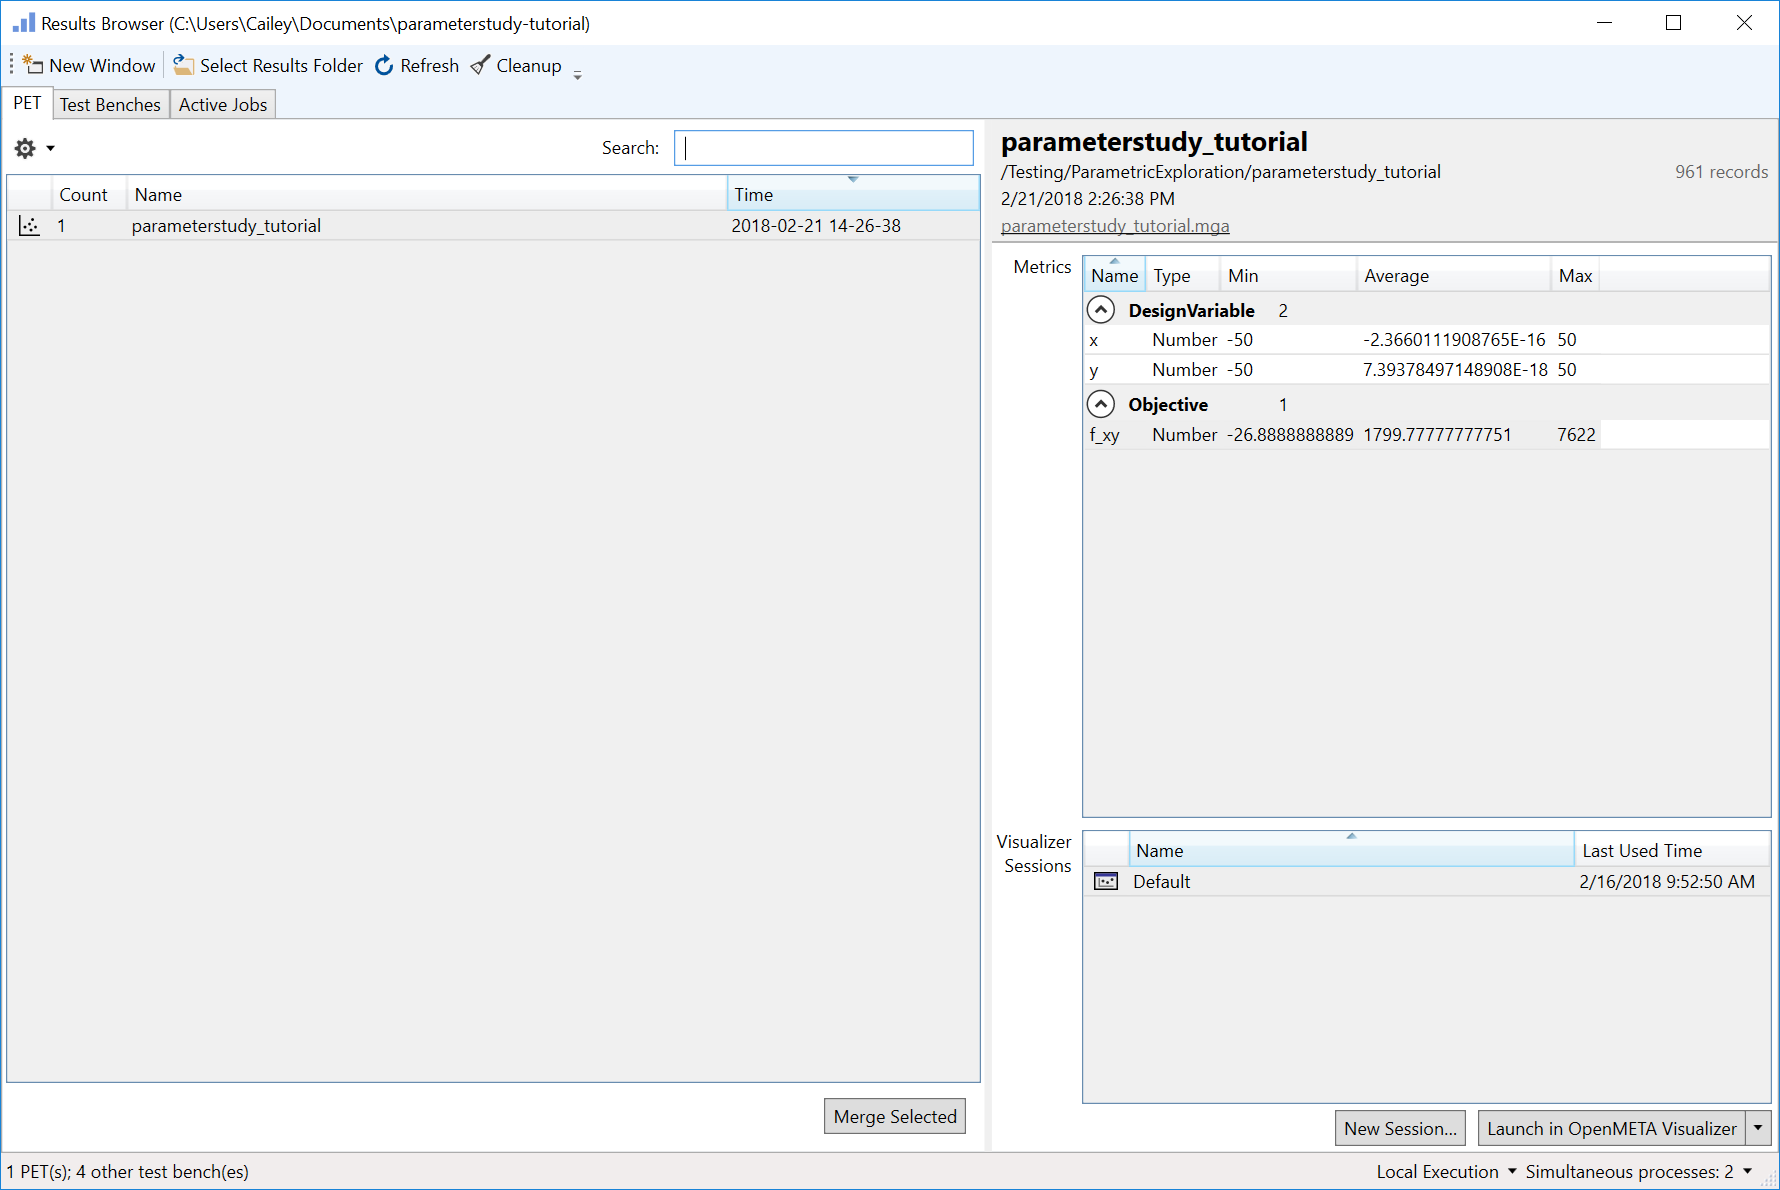
5. Left-click parameterstudy_tutorial to display run information on the right pane.
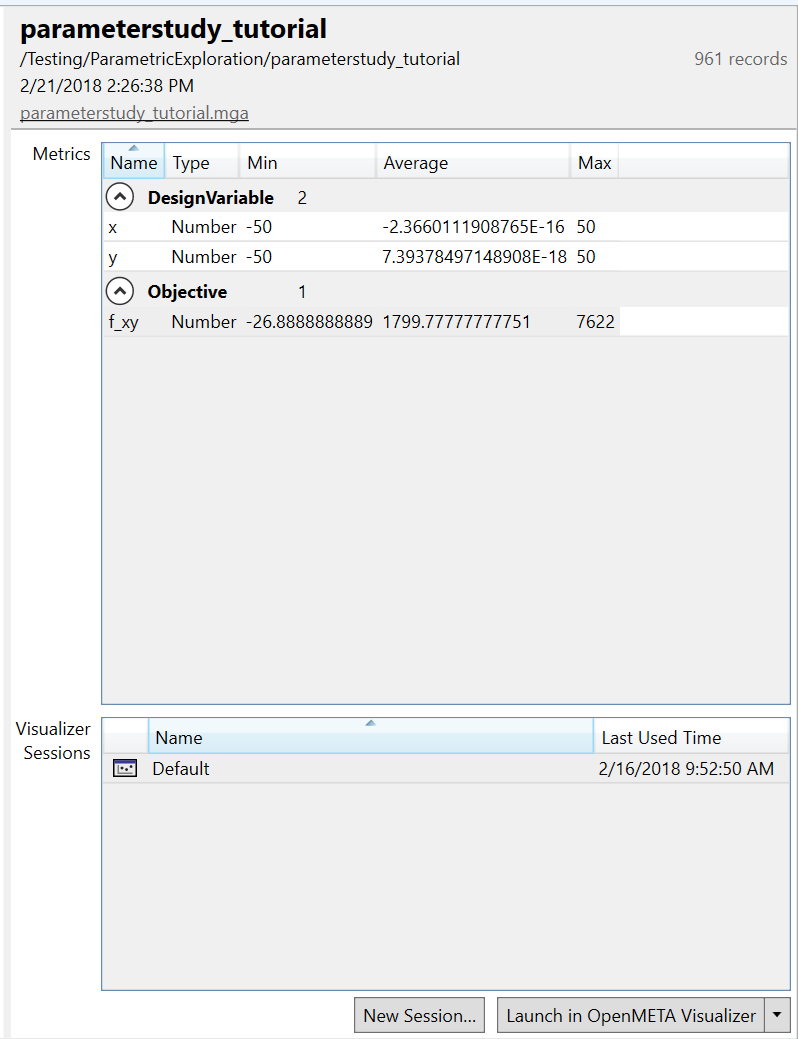
You will notice that the details pane on the right of the Results Browser indicates 961 records were generated by the run. This is what we expected from a Full Factorial DOE with 2 Design Variables sampled at 31 levels each.
Under the Objective category of the Metrics windows, we see that for all the input combinations the minimum f_xy value recorded was -26.89, the maximum f_xy value recorded was 7622, and the average f_xy value recorded was 1799.78.