Refining the PET
In the previous step, we used the PET Visualizer to estimate the Paraboloid’s global minimum to be located around (7,-8). If we were analyzing a more complicated function, we might choose to increase the number of Parameter Study sample points to get a clearer picture of the design space. In this case, however, we are confident that our function is smooth and lacking local minima, so we will instead re-run our PET with the same number of samples while decreasing the sampled area.
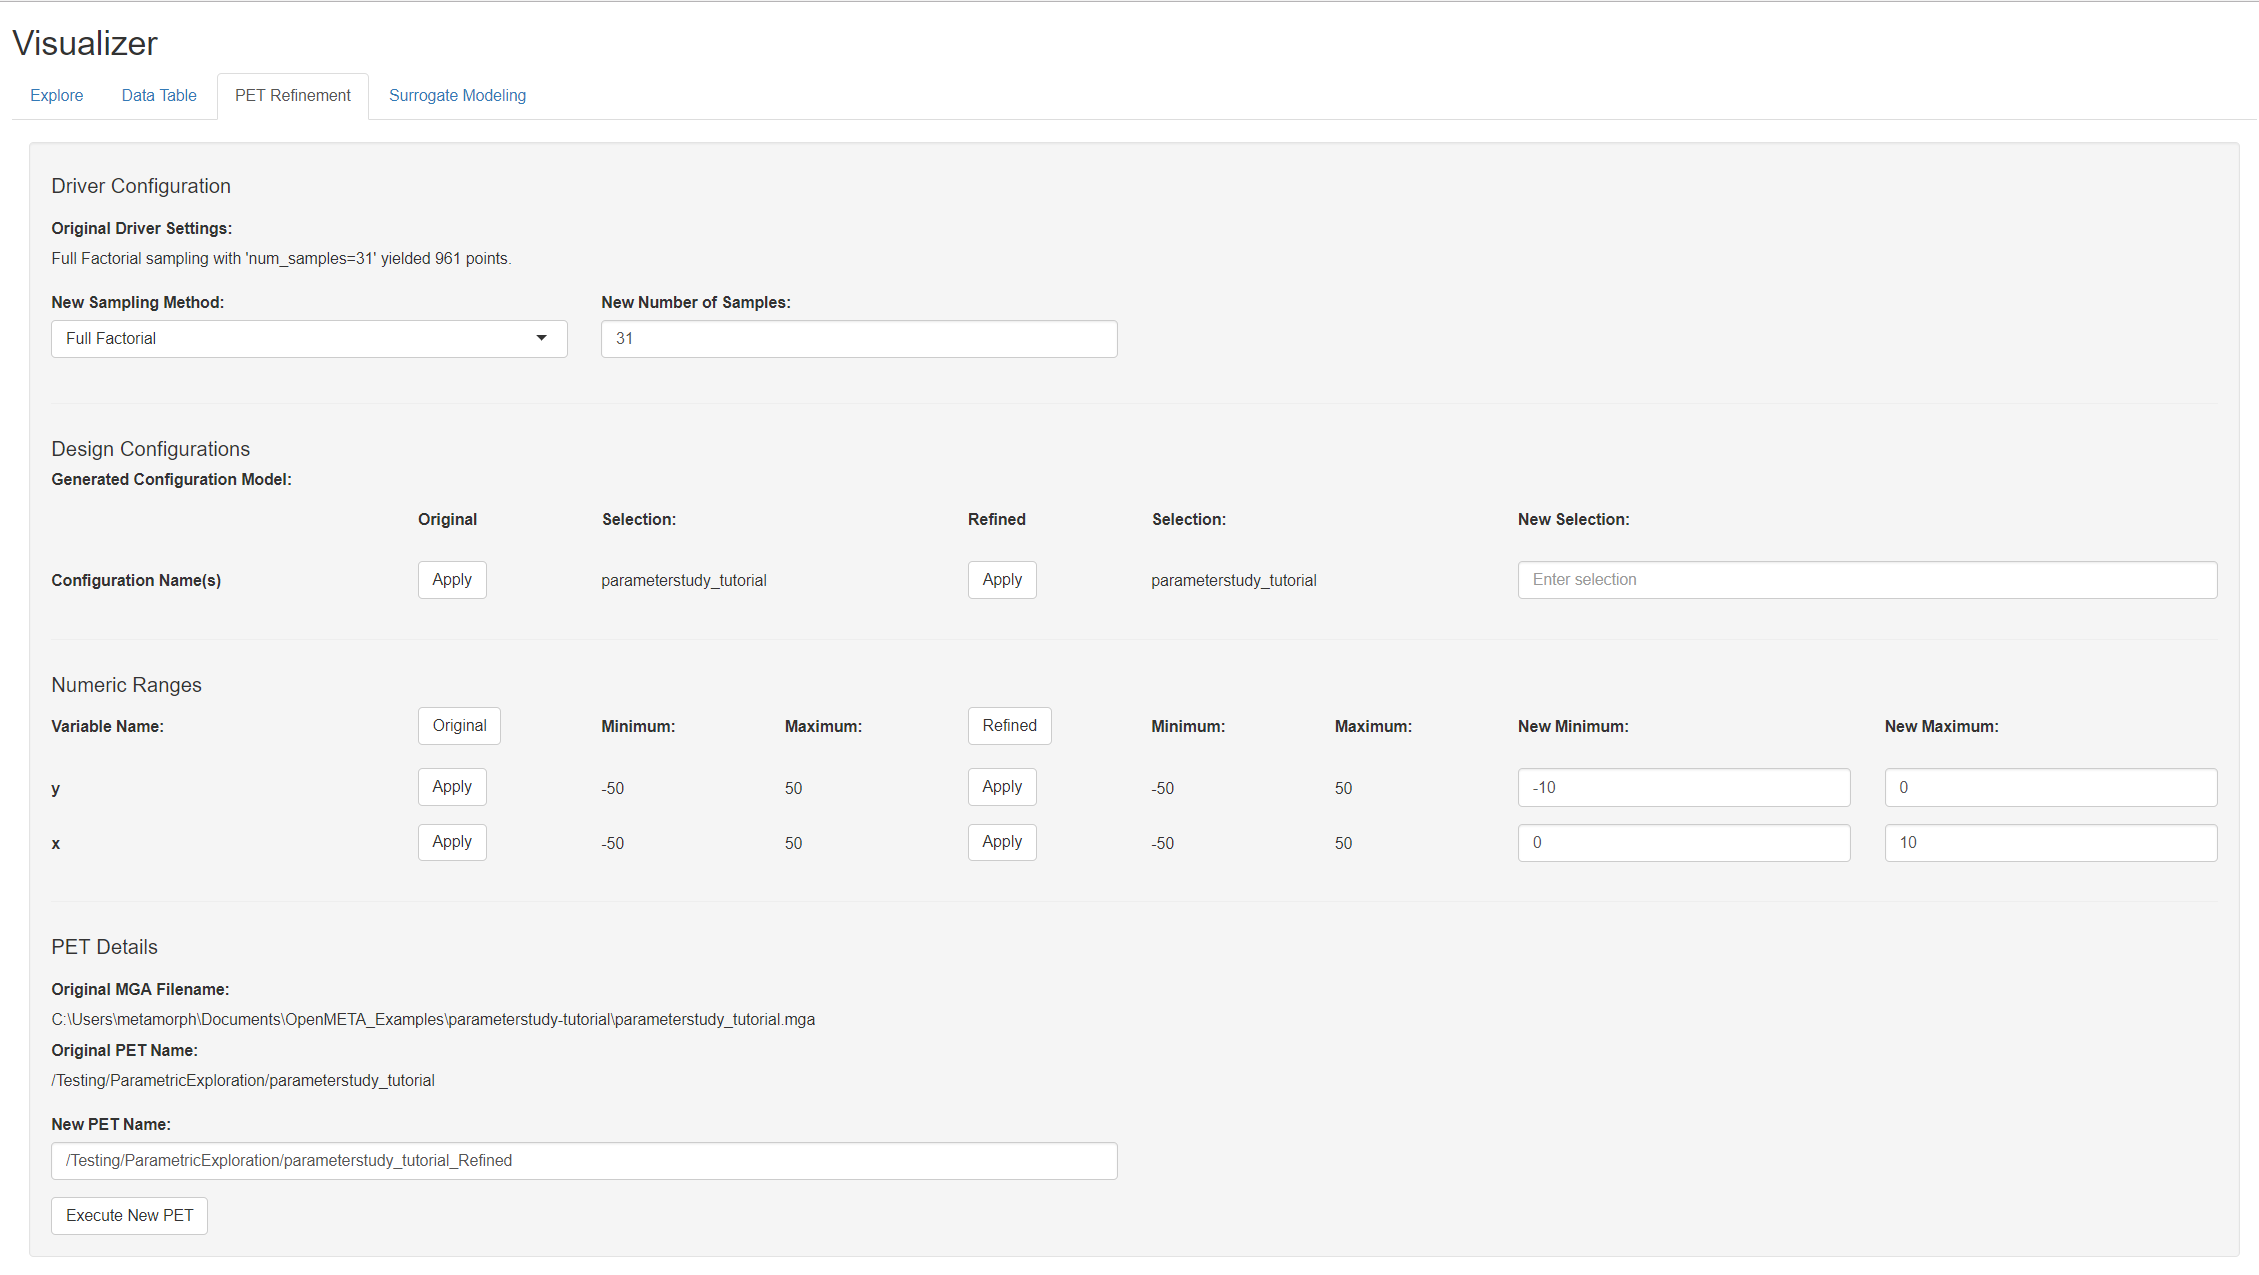
- Left-click on the PET Refinement tab in Visualizer

The Design Configurations section enables you to manage your configuration names. Though our simple design has just one configuration, more complicated projects may have hundreds.
- Click
Applyunder the Refined heading to set the name of your refined PET.

The Numeric Ranges section enables you to change Design Variable ranges.
- Set x’s New Minimum and New Maximum fields to 0 and 10 respectively.
- Set y’s New Minimum and New Maximum fields to -10 and 0 respectively.

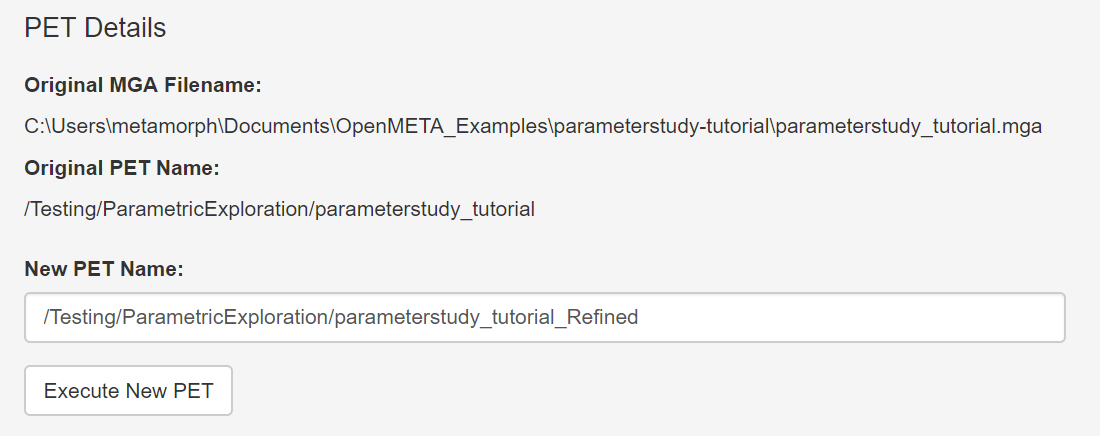
- Left-click Execute New PET

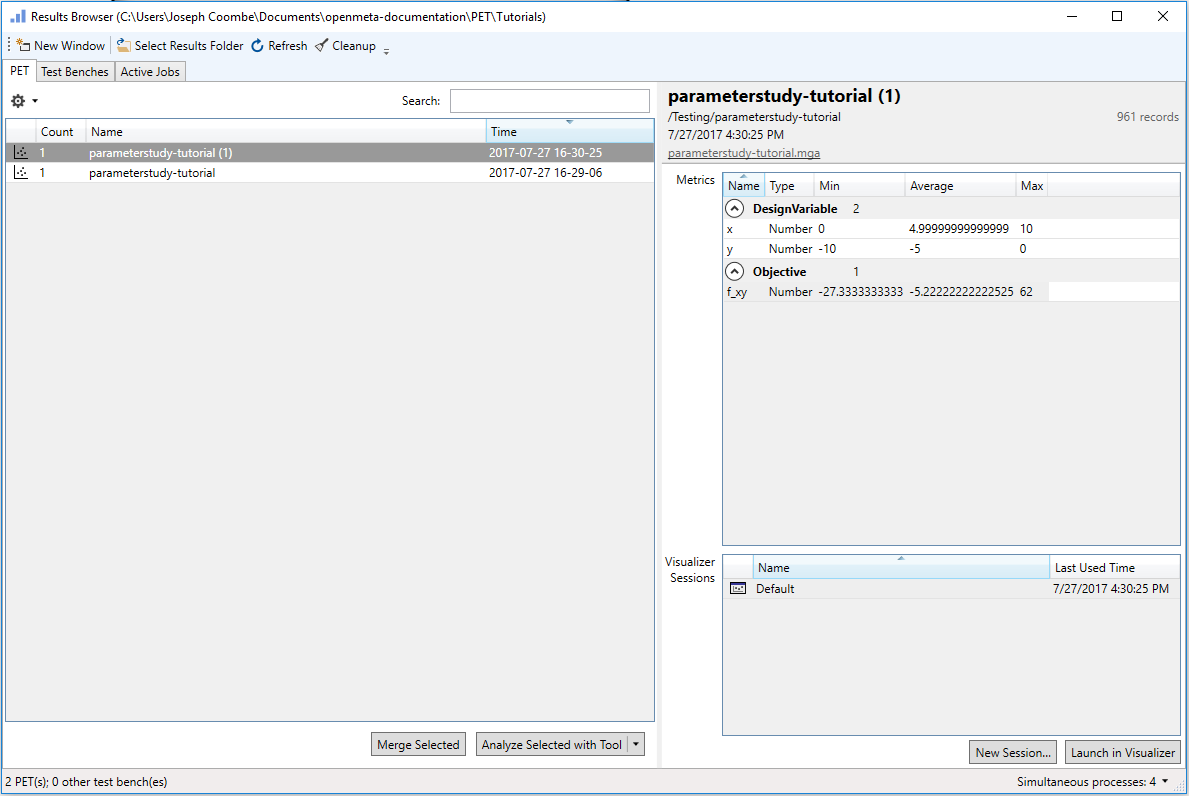
OpenMETA will apply your changes and rerun the PET. You can see this in the Results Browser.

- Select parameterstudy_tutorial (1) and left-click Launch in OpenMETA Visualizer.
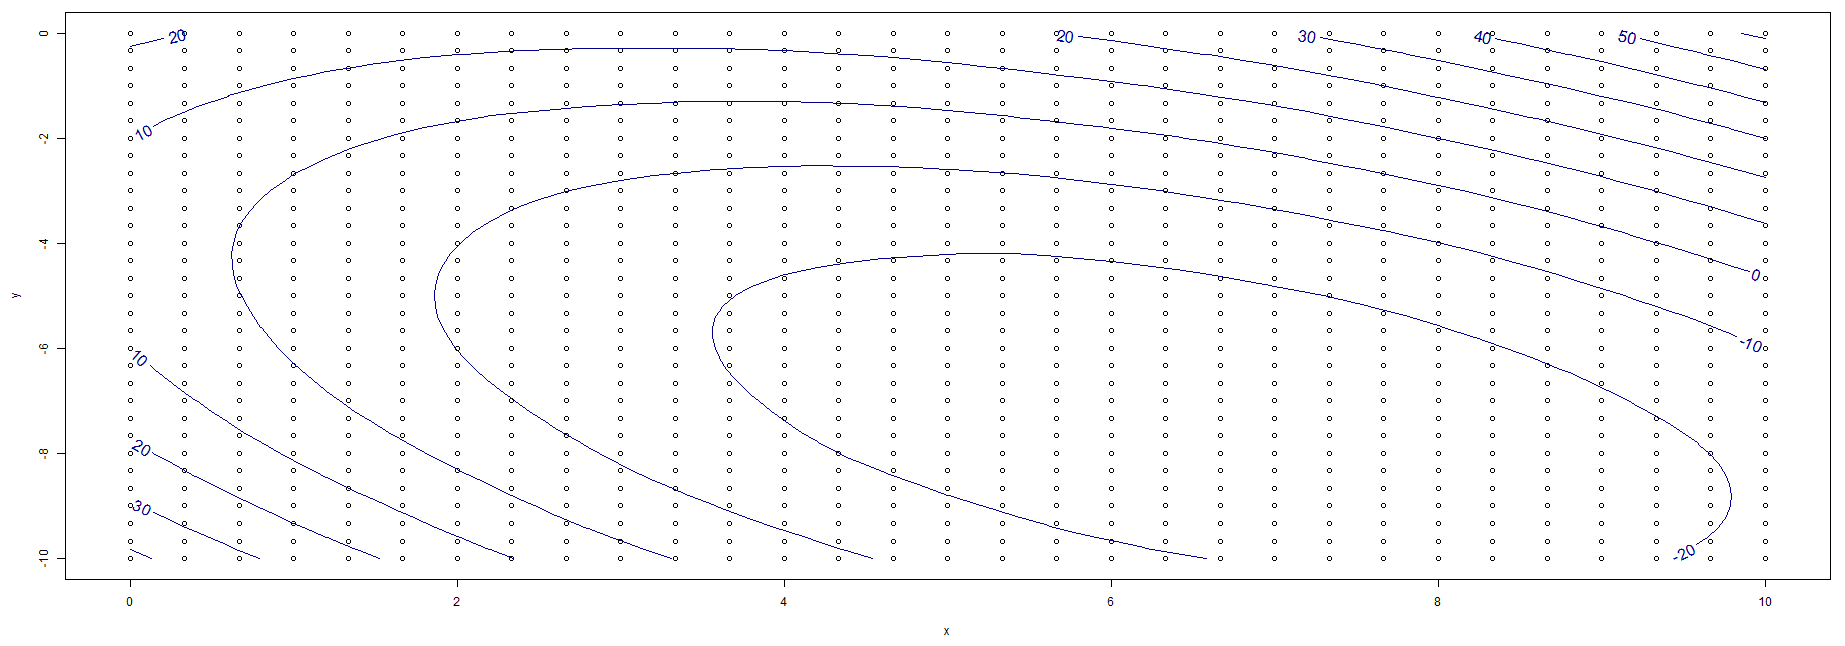
- Left-click the Single Plot tab.
- Under the Variables section, set x as the X-axis and y as the Y-axis.
- Left-click the Overlays section to expand it.
- Set f_xy as the Contour Variable.
- Left-click the Add Contour Plot box to check it.

For numerical solutions, check out the Visualizer’s Data Table tab - which allows you to view all the results in table format. Once you are there, you can sort the results to identify the minimum f_xy value sampled and its corresponding x and y values.
While the Parameter Study PET Driver is a useful tool for surveying a design space and can reveal important trends, it is generally not ideal for optimization problems.
In the next section, we will learn how to use the Optimizer PET Driver PET Driver, which is often better suited for optimization/minimization problems.