Uncertainty Quantification Tab
The Uncertainty Quantification Tab serves as a tool to analyze data using probabilistic concepts.
Weighting Tab General Configuration
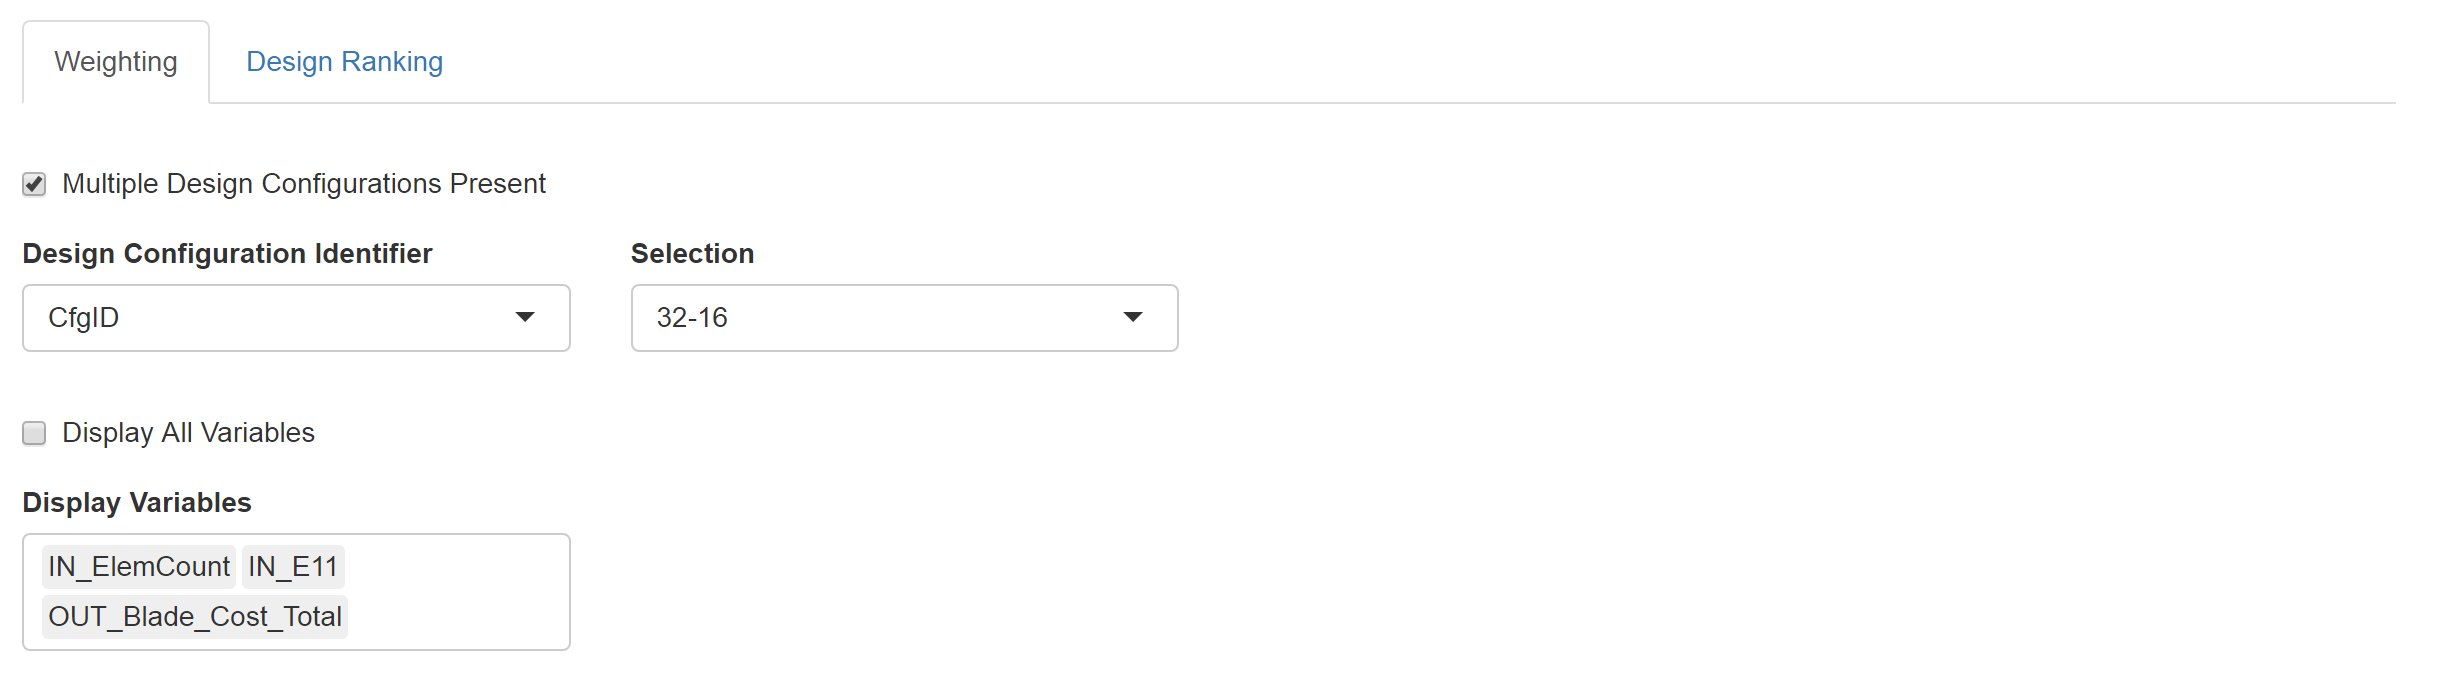
- Display All Variables: Checking this box sets all the variables in the data set to appear in the bayesian tab.
- Display Variables: When ‘Display All Variables’ is deselected, this select input allows the user to specify which variables they would like to display.
Weighting Tab Variable Configuration
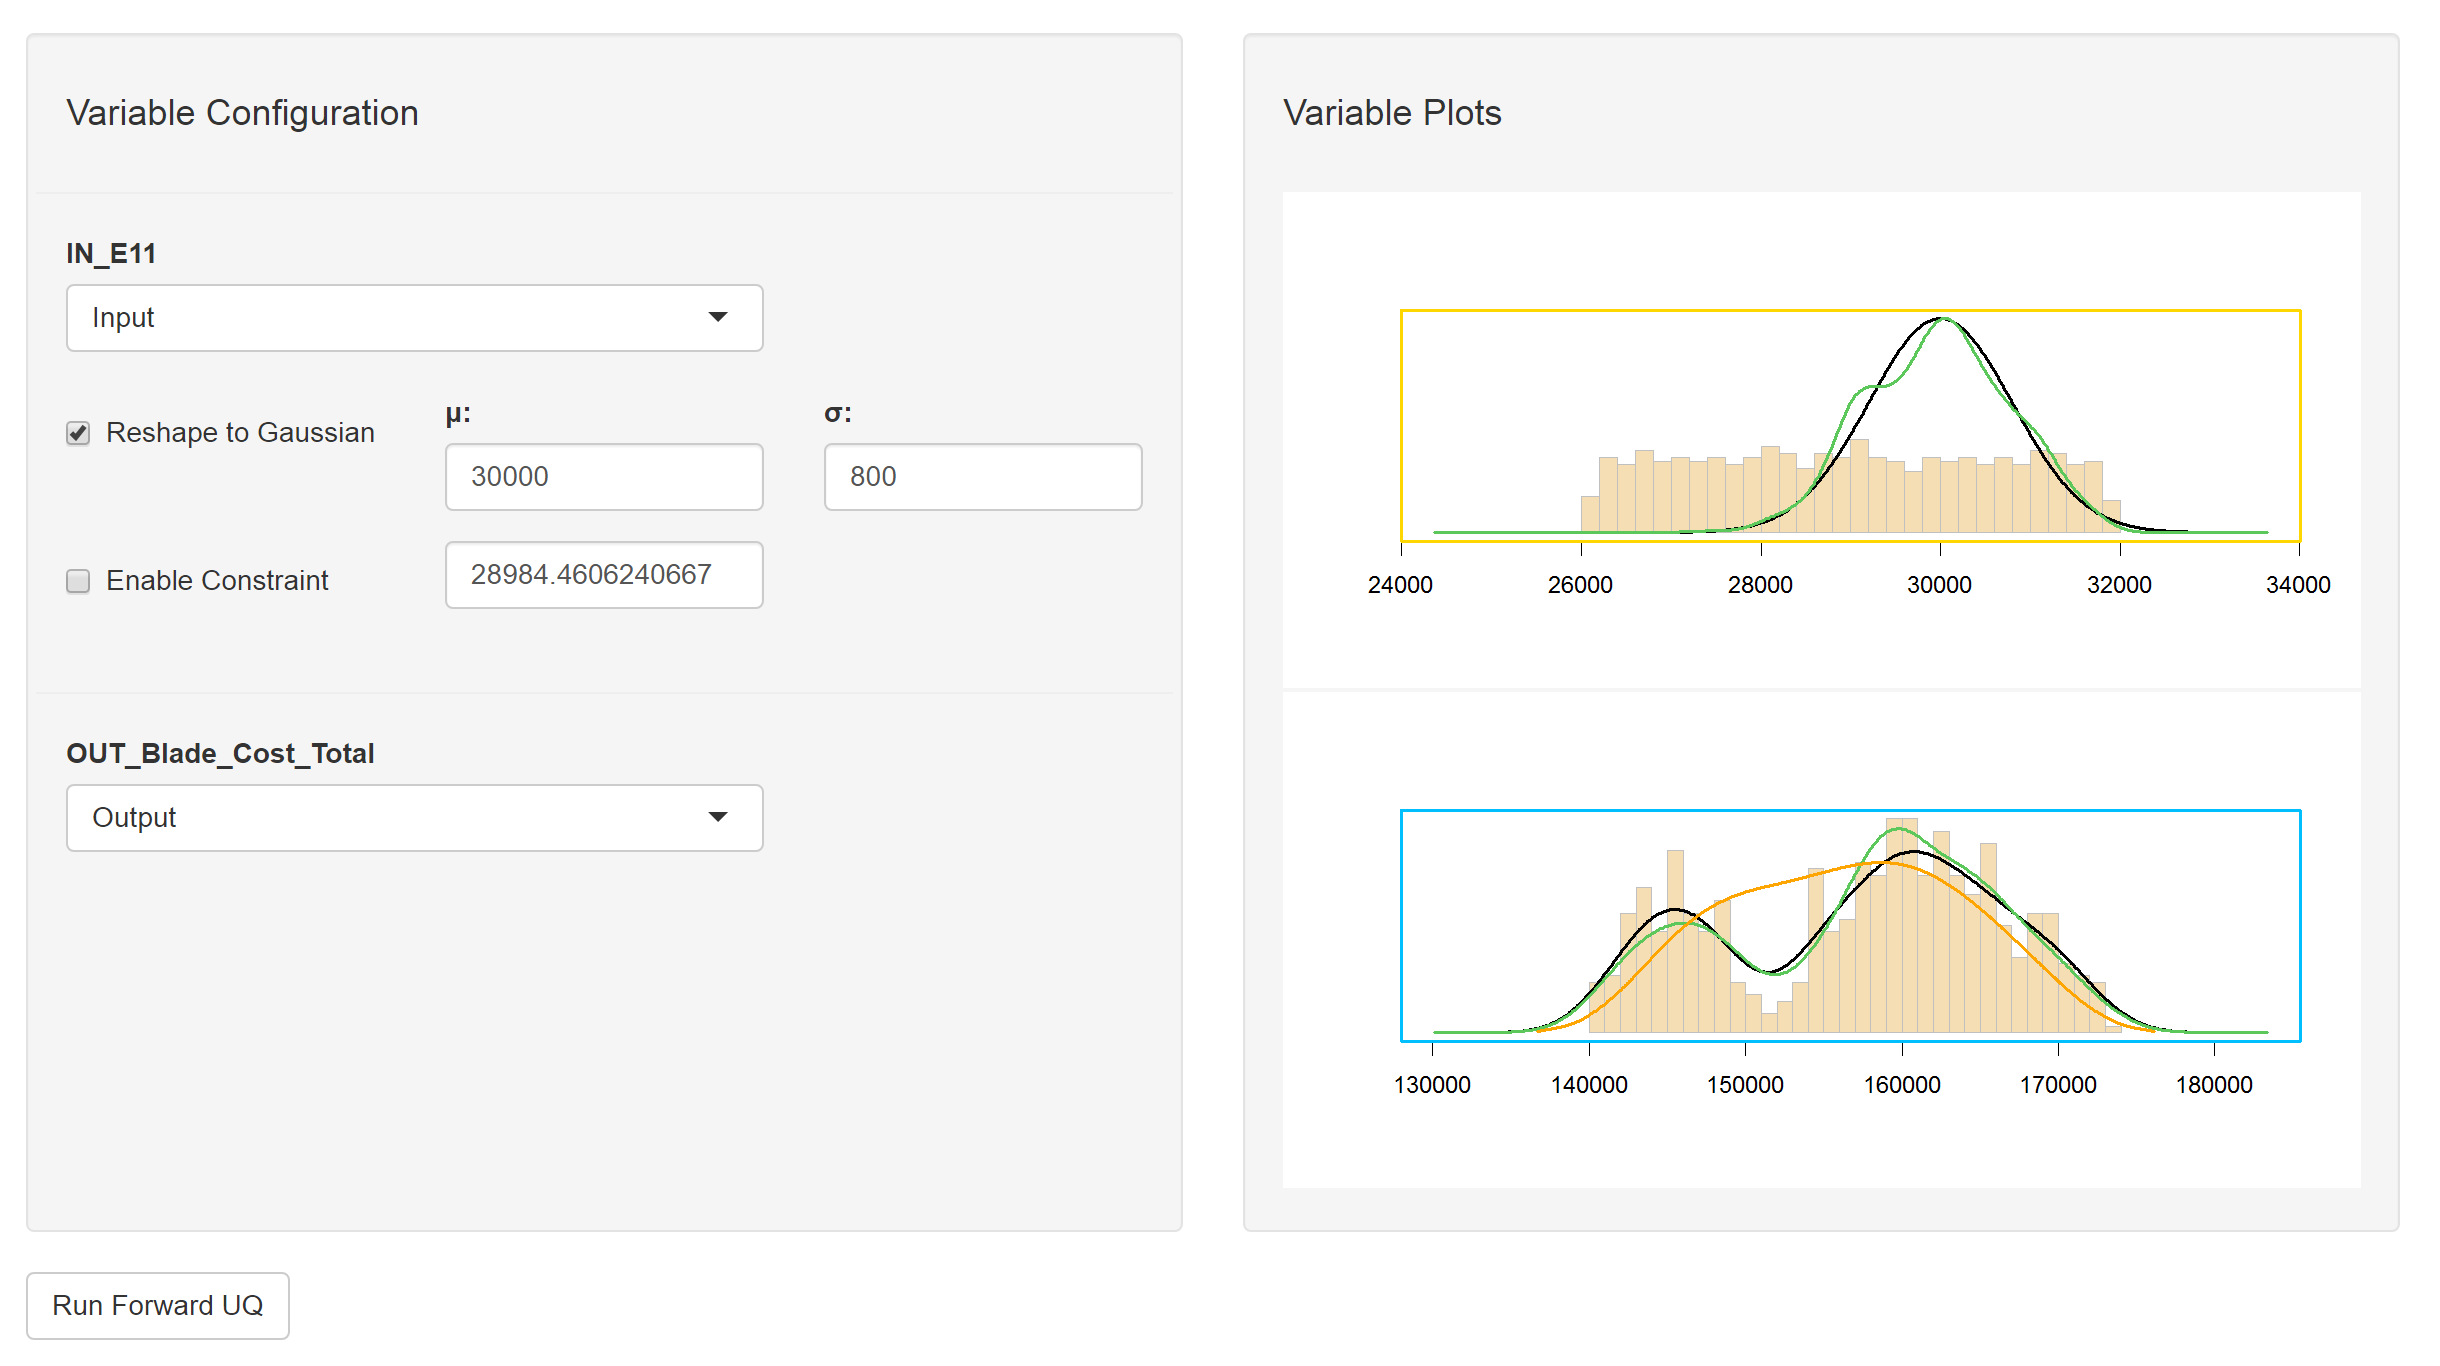
- Variable Type: This drop down list sets the type of variable, i.e. ‘Input’ or ‘Output’.
- Reshape to Gaussian: This checkbox along with the σ and μ input boxes specifies that the user would like the data to be resampled using the normal probability distribution specified.
Weighting Tab Variable Plots
The plots for each of the variables are displayed immediately to the right of the variable options. Below is a legend for the plots; the default color for each element is listed in parentheses.
- Plot Frame: This will be ‘Yellow’ for ‘Inputs’ and ‘Blue’ for ‘Outputs.’
- Histogram (Wheat): This histogram represents the raw data before any shaping/resampling.
- Reshaping Distribution (Black): This is the weighting distribution used to resample the data.
- Resampled Distribution (Green): This is the resampled distribution.
- Posterior Distribution (Orange): This is posterior distribution after Forward Uncertainty Quantification has been performed.
At the bottom of the variable configuration is the Run Forward UQ button. This will perform a forward uncertainty quantification on the data and add a posterior distribution to the output plots. Note at least one “Enable Constraint” checkbox must be checked for forward uncertainty quantification to run successfully.
Probability Queries
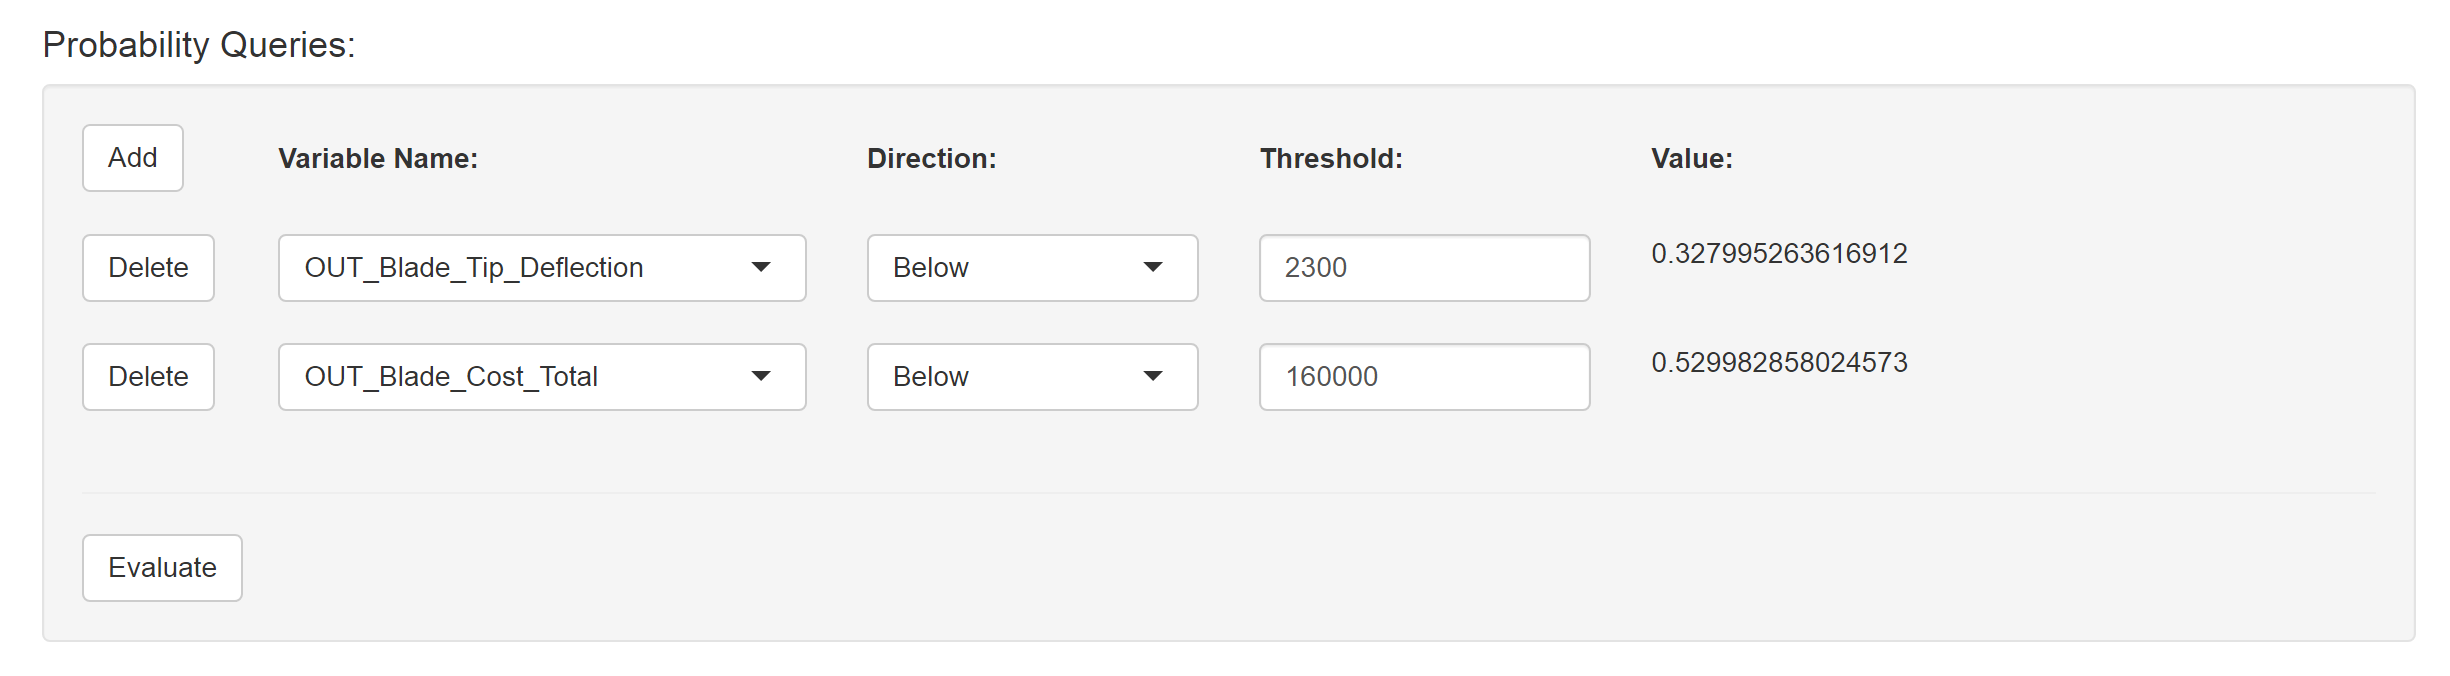
This section allows us to evaluate the integration of the area under the resampled distributions below or above a certain threshold. These probabilities are used additionally in the Design Ranking Tab to rank the designs.
Design Ranking Tab
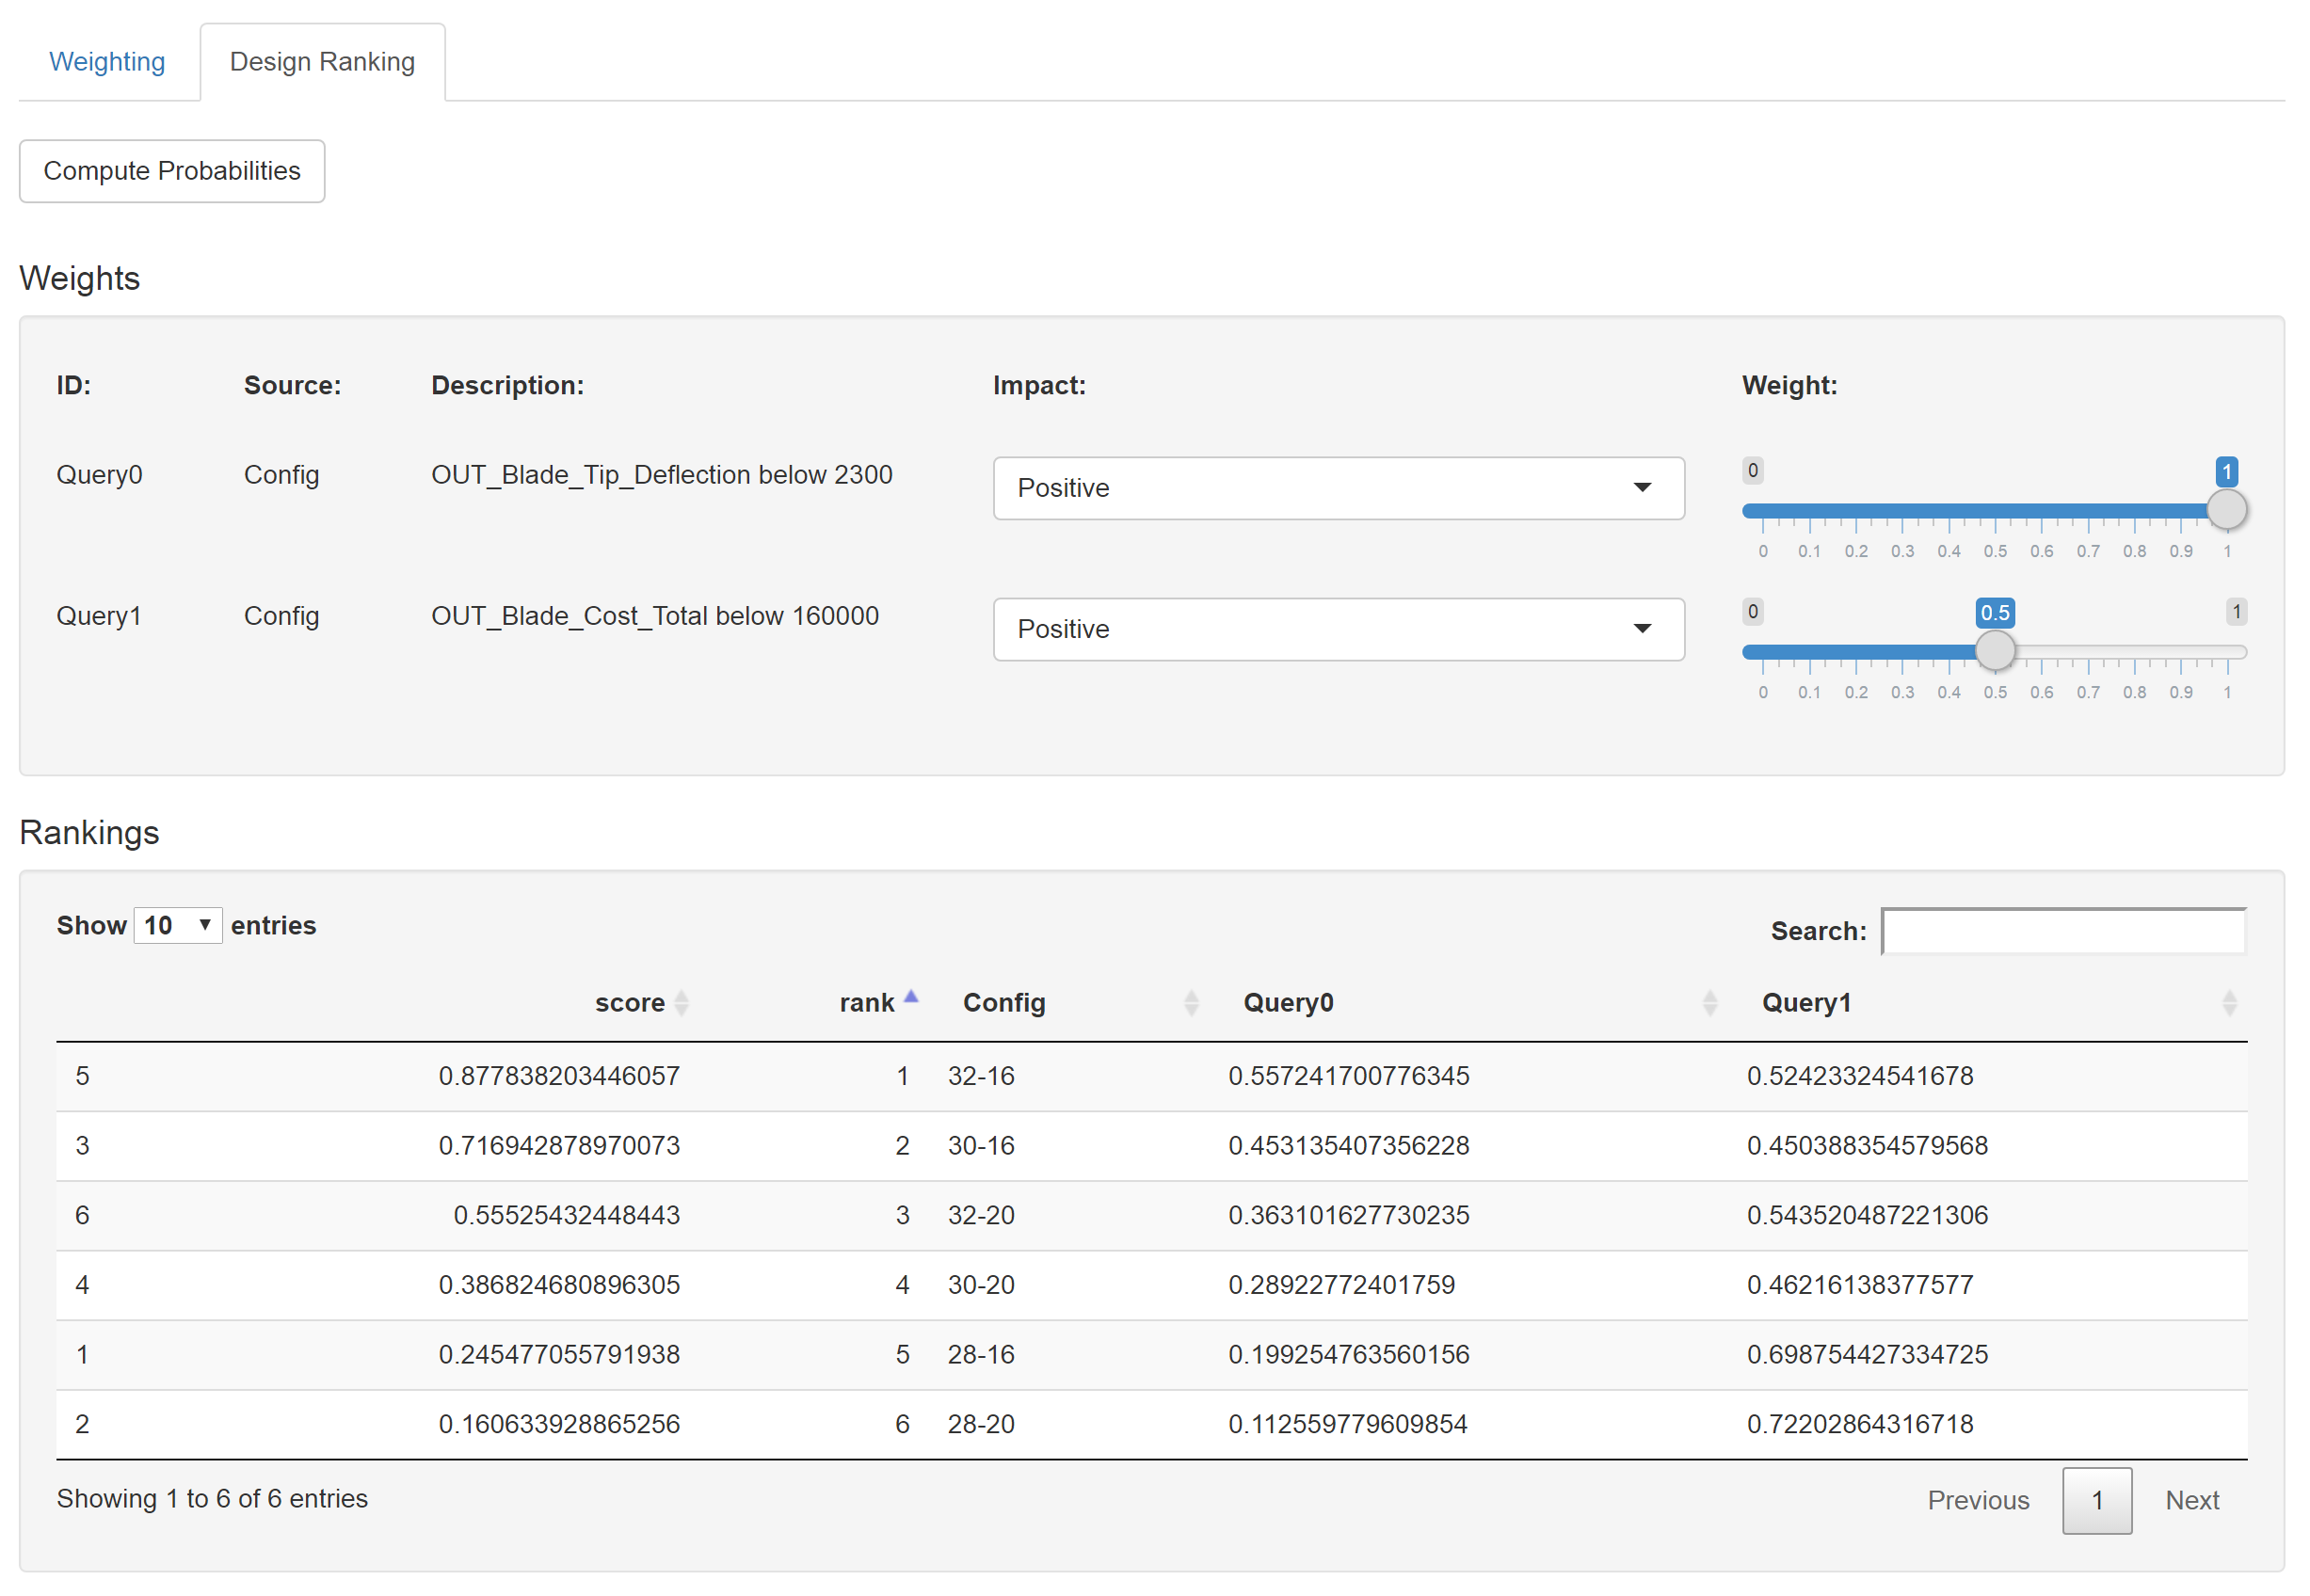
The Design Ranking Tab uses the ‘TOPSIS’ package on CRAN to perform a multi-criteria decision making optimization on the result of performing all of the queries on all of the different design configurations present. This allows the user to rank the designs based on the queries.
- Weights: The Weights sections allows you to specify the relative importance of each of the queries.
- Rankings: The rankings are displayed in a table.