Explore Tab
The Explore Tab has three sub-tabs that dive progressively deeper into the given dataset.
The Pairs Plot Tab provides a way to explore overall trends in the data. The Single Plot Tab offers the additional visualization aids such as contour and pareto plots to be overlaid on a plot of two specific variables. Lastly, the Point Details Tab allows for viewing or launching artifacts from a specific data point in the dataset.
Pairs Plot Tab
The first sub-tab in the Explore tab is the Pairs Plot tab.
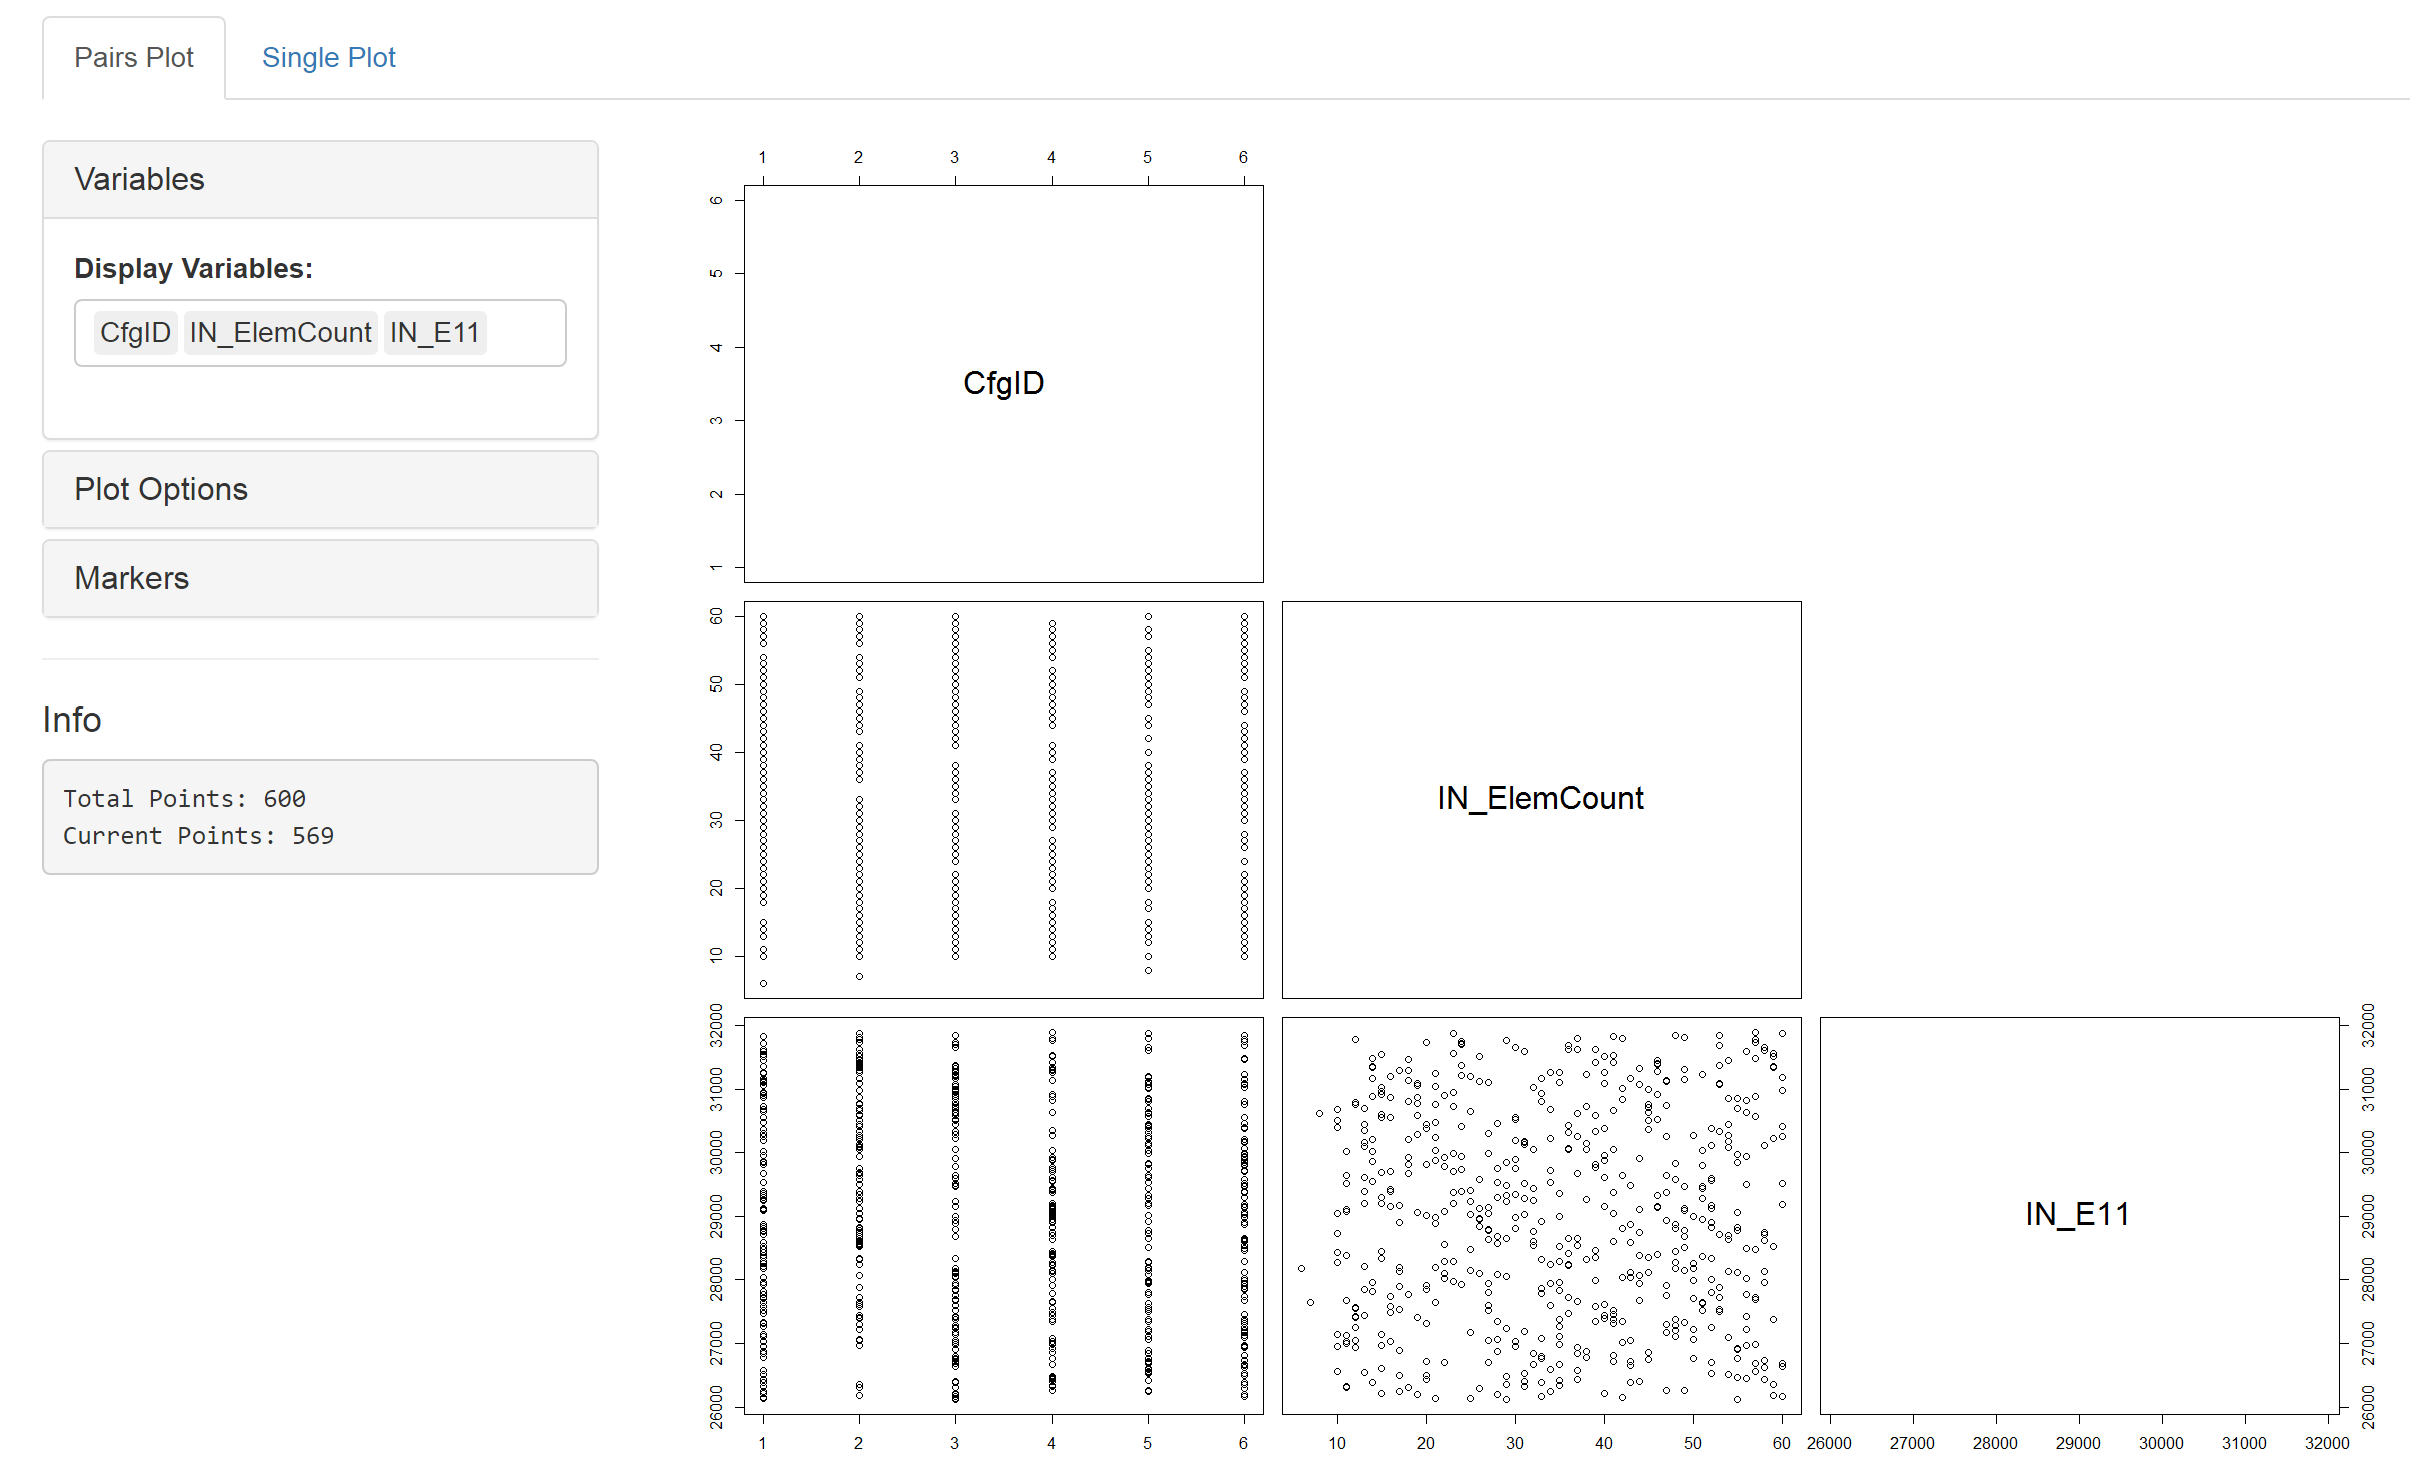
Variables
- Display Variables: This is where you set what the variables are displayed on the main plot.
- Render Plot: This button is available only if ‘Render Automatically’ option is unselected. Clicking this button produces a plot based on current user settings.
Plot Options
- Render Automatically: This option causes the pairs plot to automatically update anytime a setting is changed. If this box is unselected, a ‘Render Plot’ button appears in the Variables panel, and the plot will wait to update until a user clicks this button. This is useful for changing the variables of the plot when working with a large dataset or relatively large number of variables.
- Overlay Trendlines: Activating this option displays trendlines pairs plot.
- Display upper panel: Activating this option displays the upper panel as well as the lower panel of the pairs plot.
Markers
- Plot Markers: This selects the marker used to create the plot.
- Marker Size: This selects the relative size of each of the points.
Export
- Dataset: Downloads a csv file containing all the data used to create the current plot.
- Plot: Downloads a pdf of the plot display.
Info Pane
This box shows the information about the data set. “Total Points” shows how many data points are in the set. “Current Points” shows how many points are being used for plotting.
Single Plot Tab
The second sub-tab in the Explore tab is the Single Plot tab.
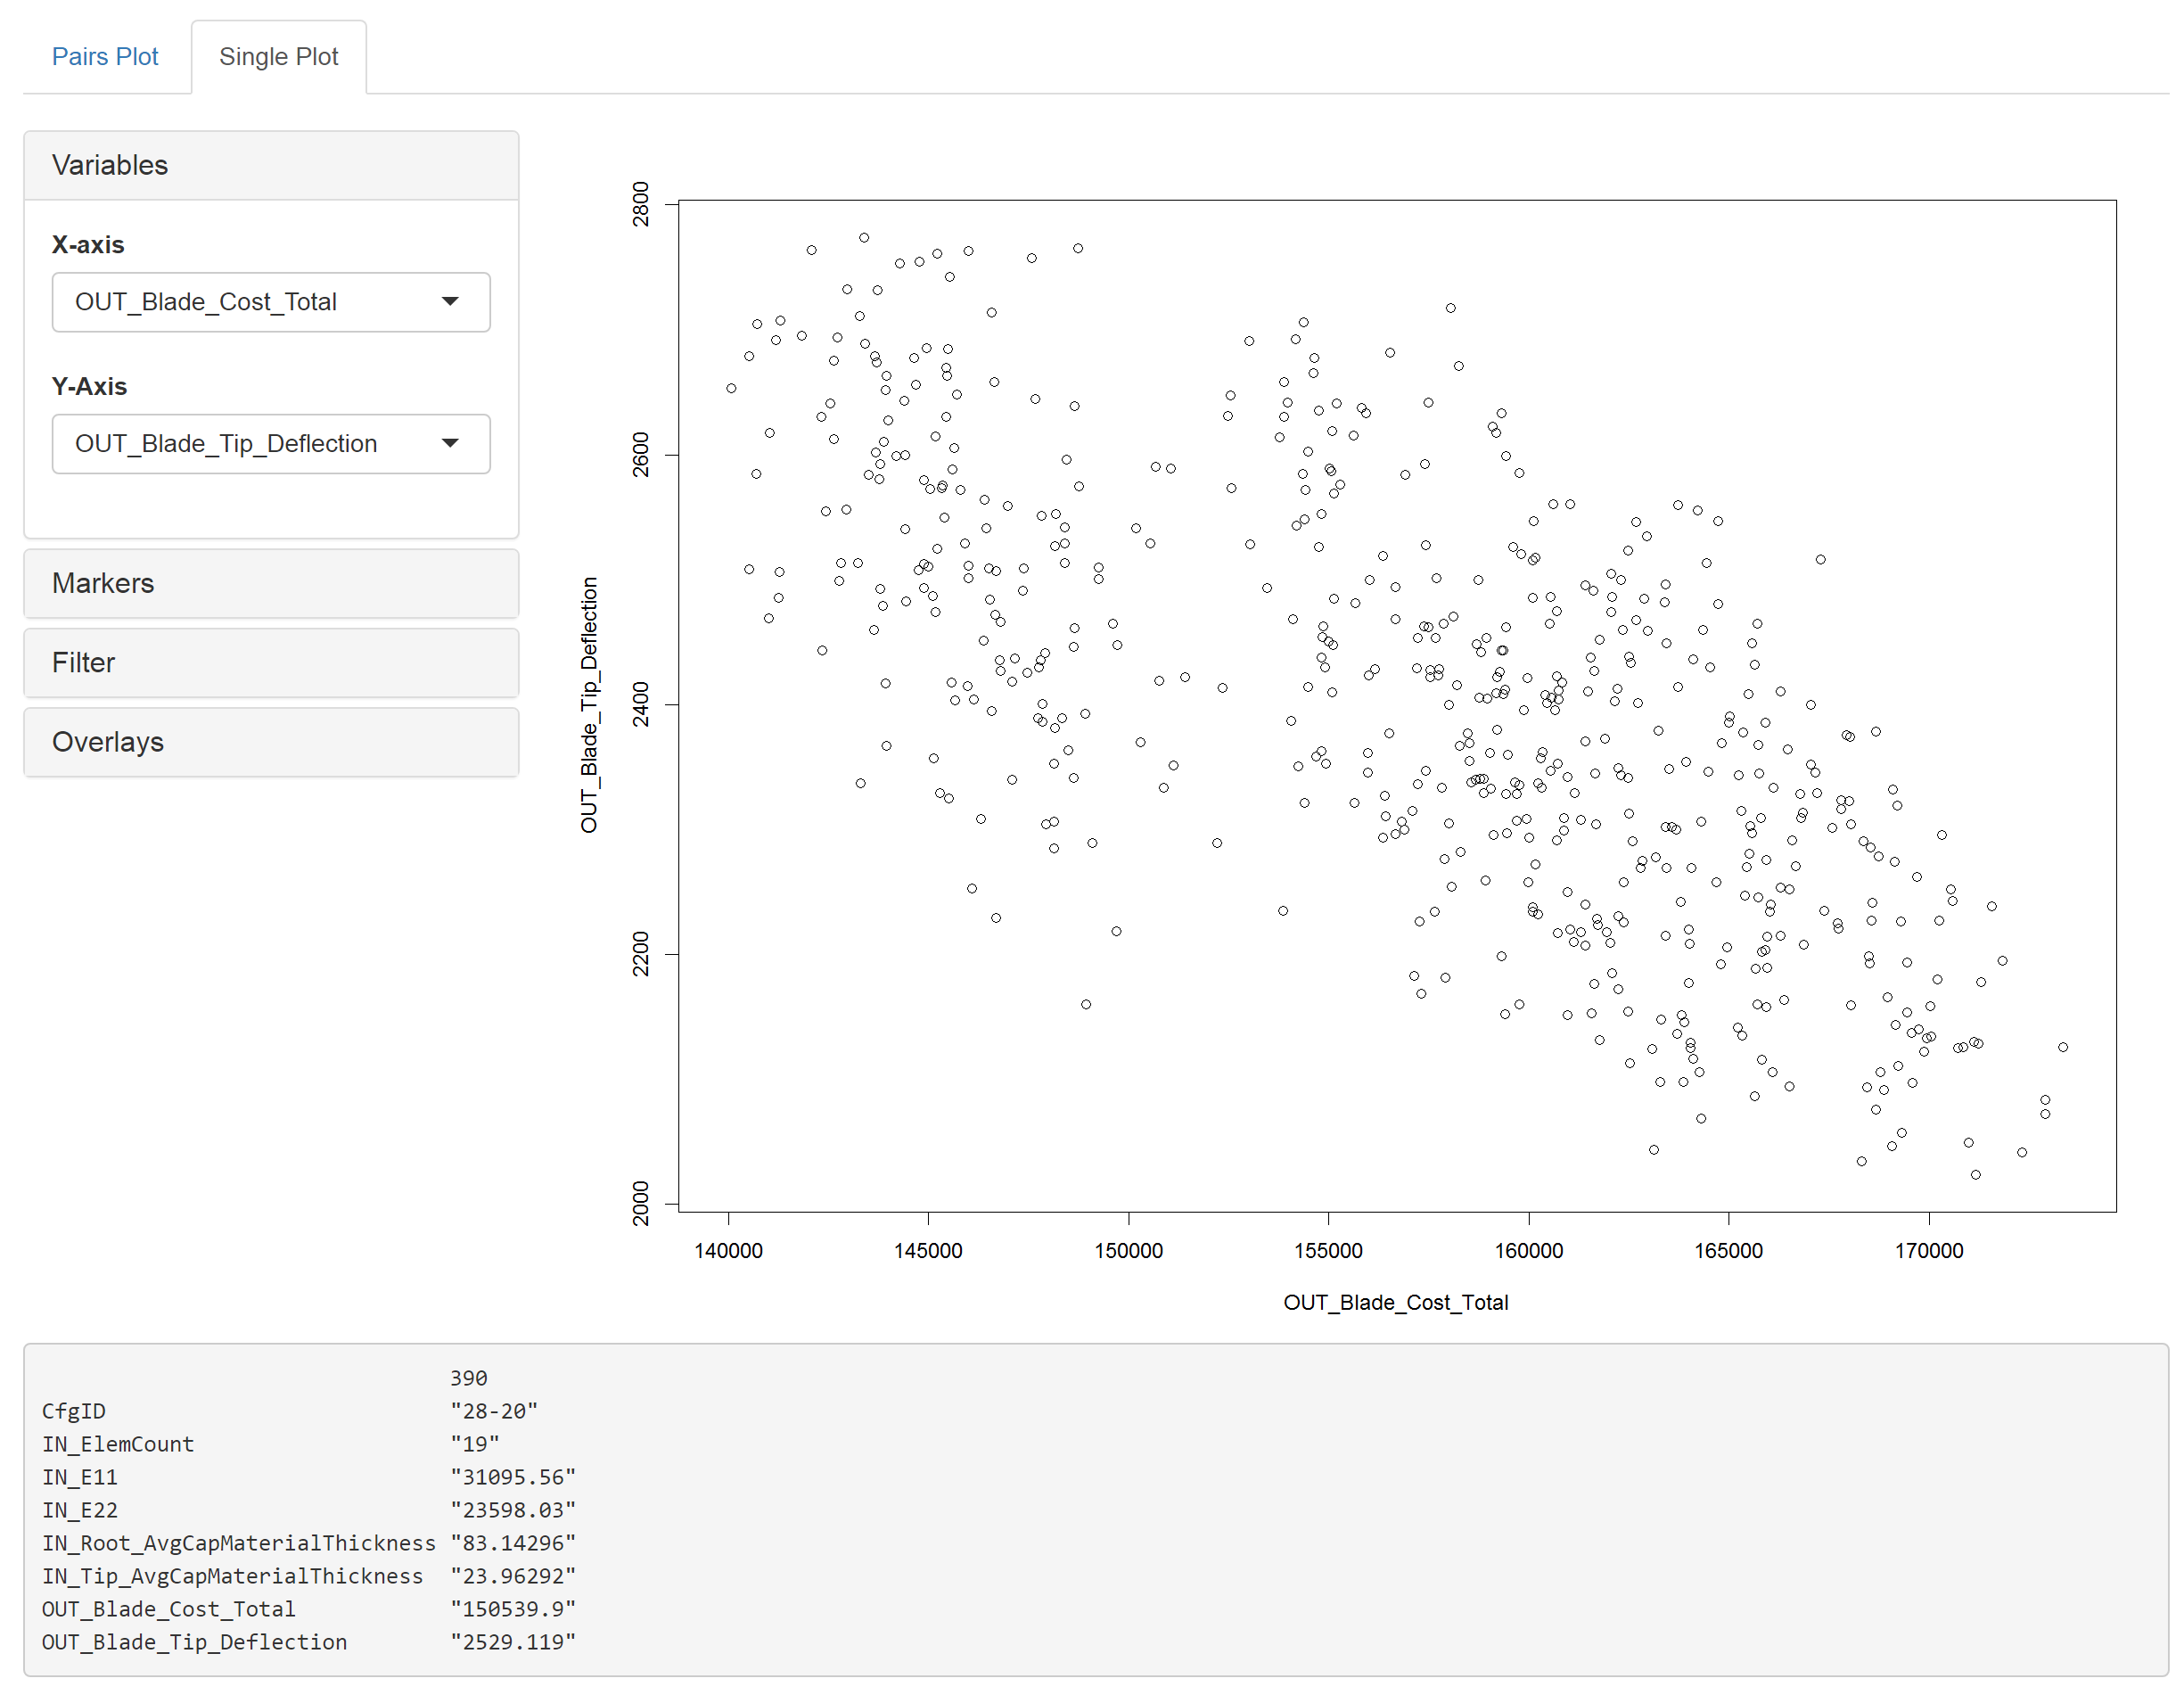
Variables
- X-axis: Set the variable for the x axis.
- Y-axis: Set the variable for the y axis.
Markers
- Plot Markers: This selects the marker used to create the plot.
- Marker Size: This selects the relative size of each of the points.
Filter
A user can click and drag a selection on the plot, and once a selection is made, these buttons will adjust the global filters for the x and/or y variable to match the range of the selection.
Overlays
- Add Pareto Plot: This enables the addition of a pareto plot and allows you to specify the objectives.
- Add Contour Plot: This enables the addition of a contour plot and allows you to specify the third variable for the contour.
Near Points Info
By clicking on the graph, data points near the click will display their info in this panel.
Point Details Tab
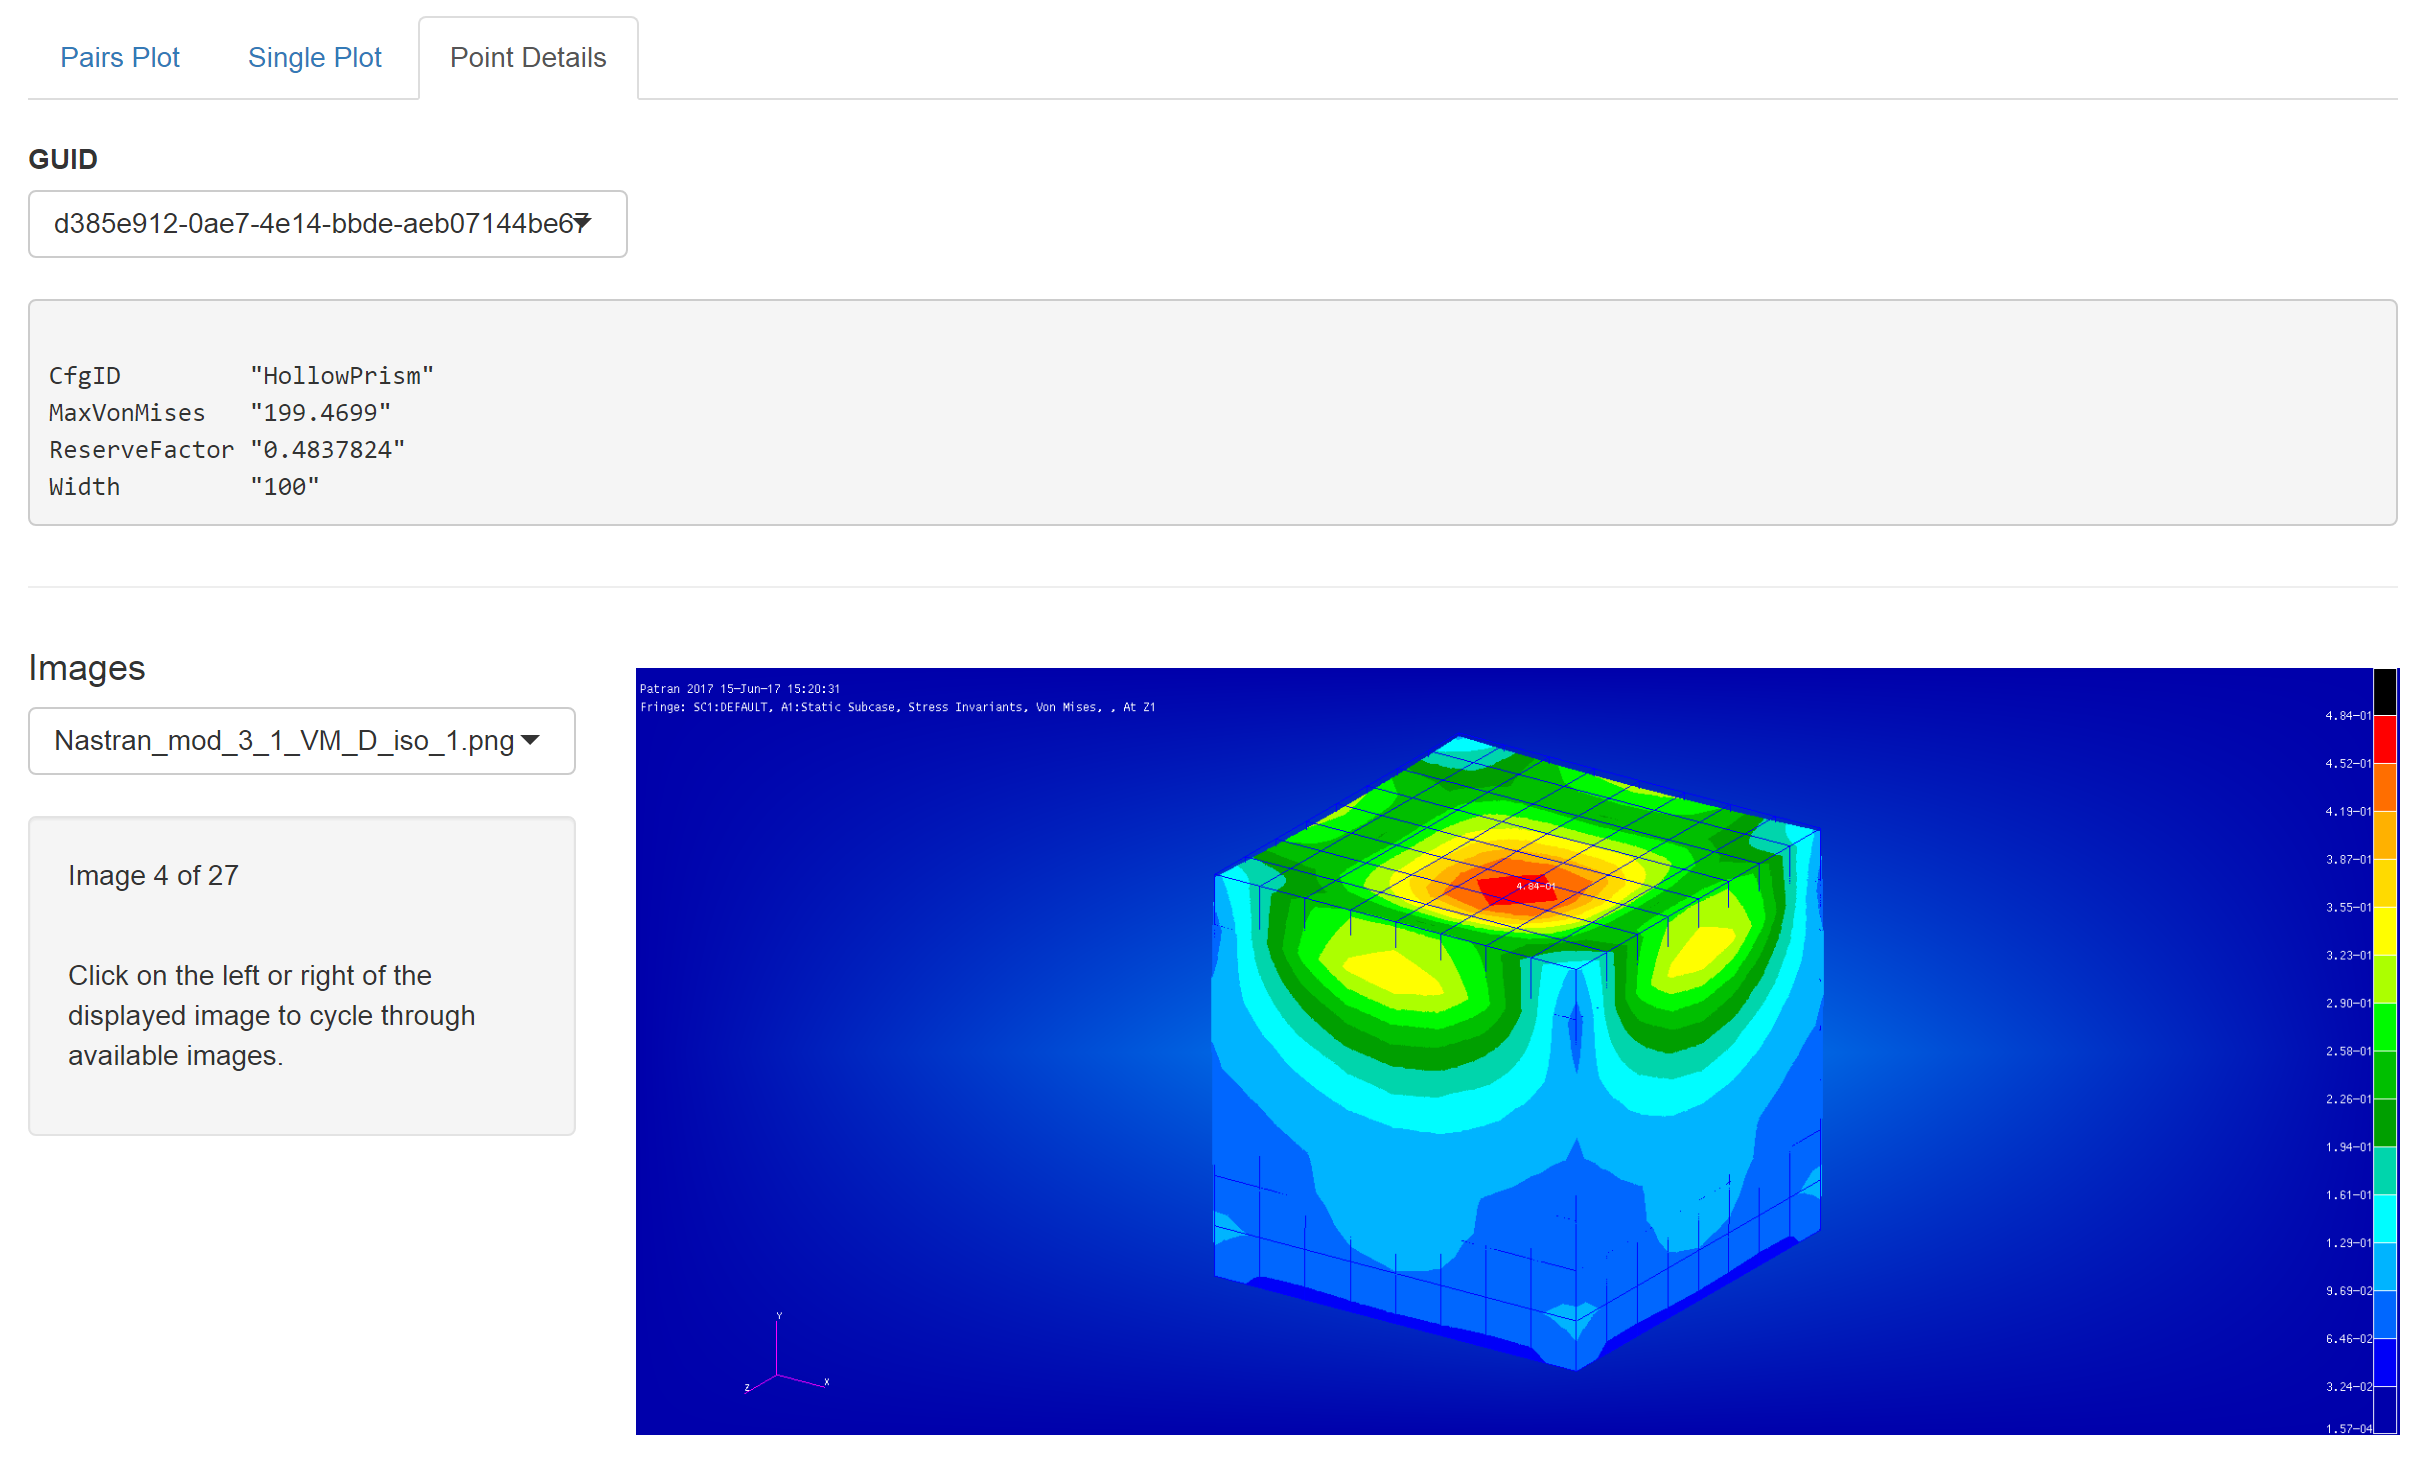
The third sub-tab in the Explore tab is the Point Details tab. This tab is designed to allow for examination of individual points in a dataset. It is context-sensitive and will show different UI sections depending upon the artifacts saved during each execution. As you can see below the “Images” section has appeared because a set of images was saved at each iteration of this FEA PET.
This tab can be reached in one of two ways:
- Clicking the tab name.
- Double-clicking on a point in the Single Plot Tab tab.
The GUID select box shows the currently displayed point and allows for the selection of any arbitrary data point.
Images Section
If the PET saved a collection of images in an Images.zip file during the
execution of the specific point that is being explored, then the captured
images are accessible for viewing here.
As specified in the information box in the sidebar, you can cycle through the images by clicking on the left or right side of the display image space.
SIMDIS Section
SIMDIS is a set of software tools that provide two- and three-dimensional interactive graphical and video display of live and post processed simulation, test, and operational data.

This section of the Point Details tab appears when the user has saved a set
of files in a SIMDIS.zip file. Each of the relevant files are exposed in a
select box, and when you’ve selected the desired file, you can simply click
Launch in SIMDIS to open the file in SIMDIS directly.