Data Table Tab
The Data Table Tab is useful for exploring the data numerically. It also provides a number of processing tools to sort and rank the data on certain criteria.
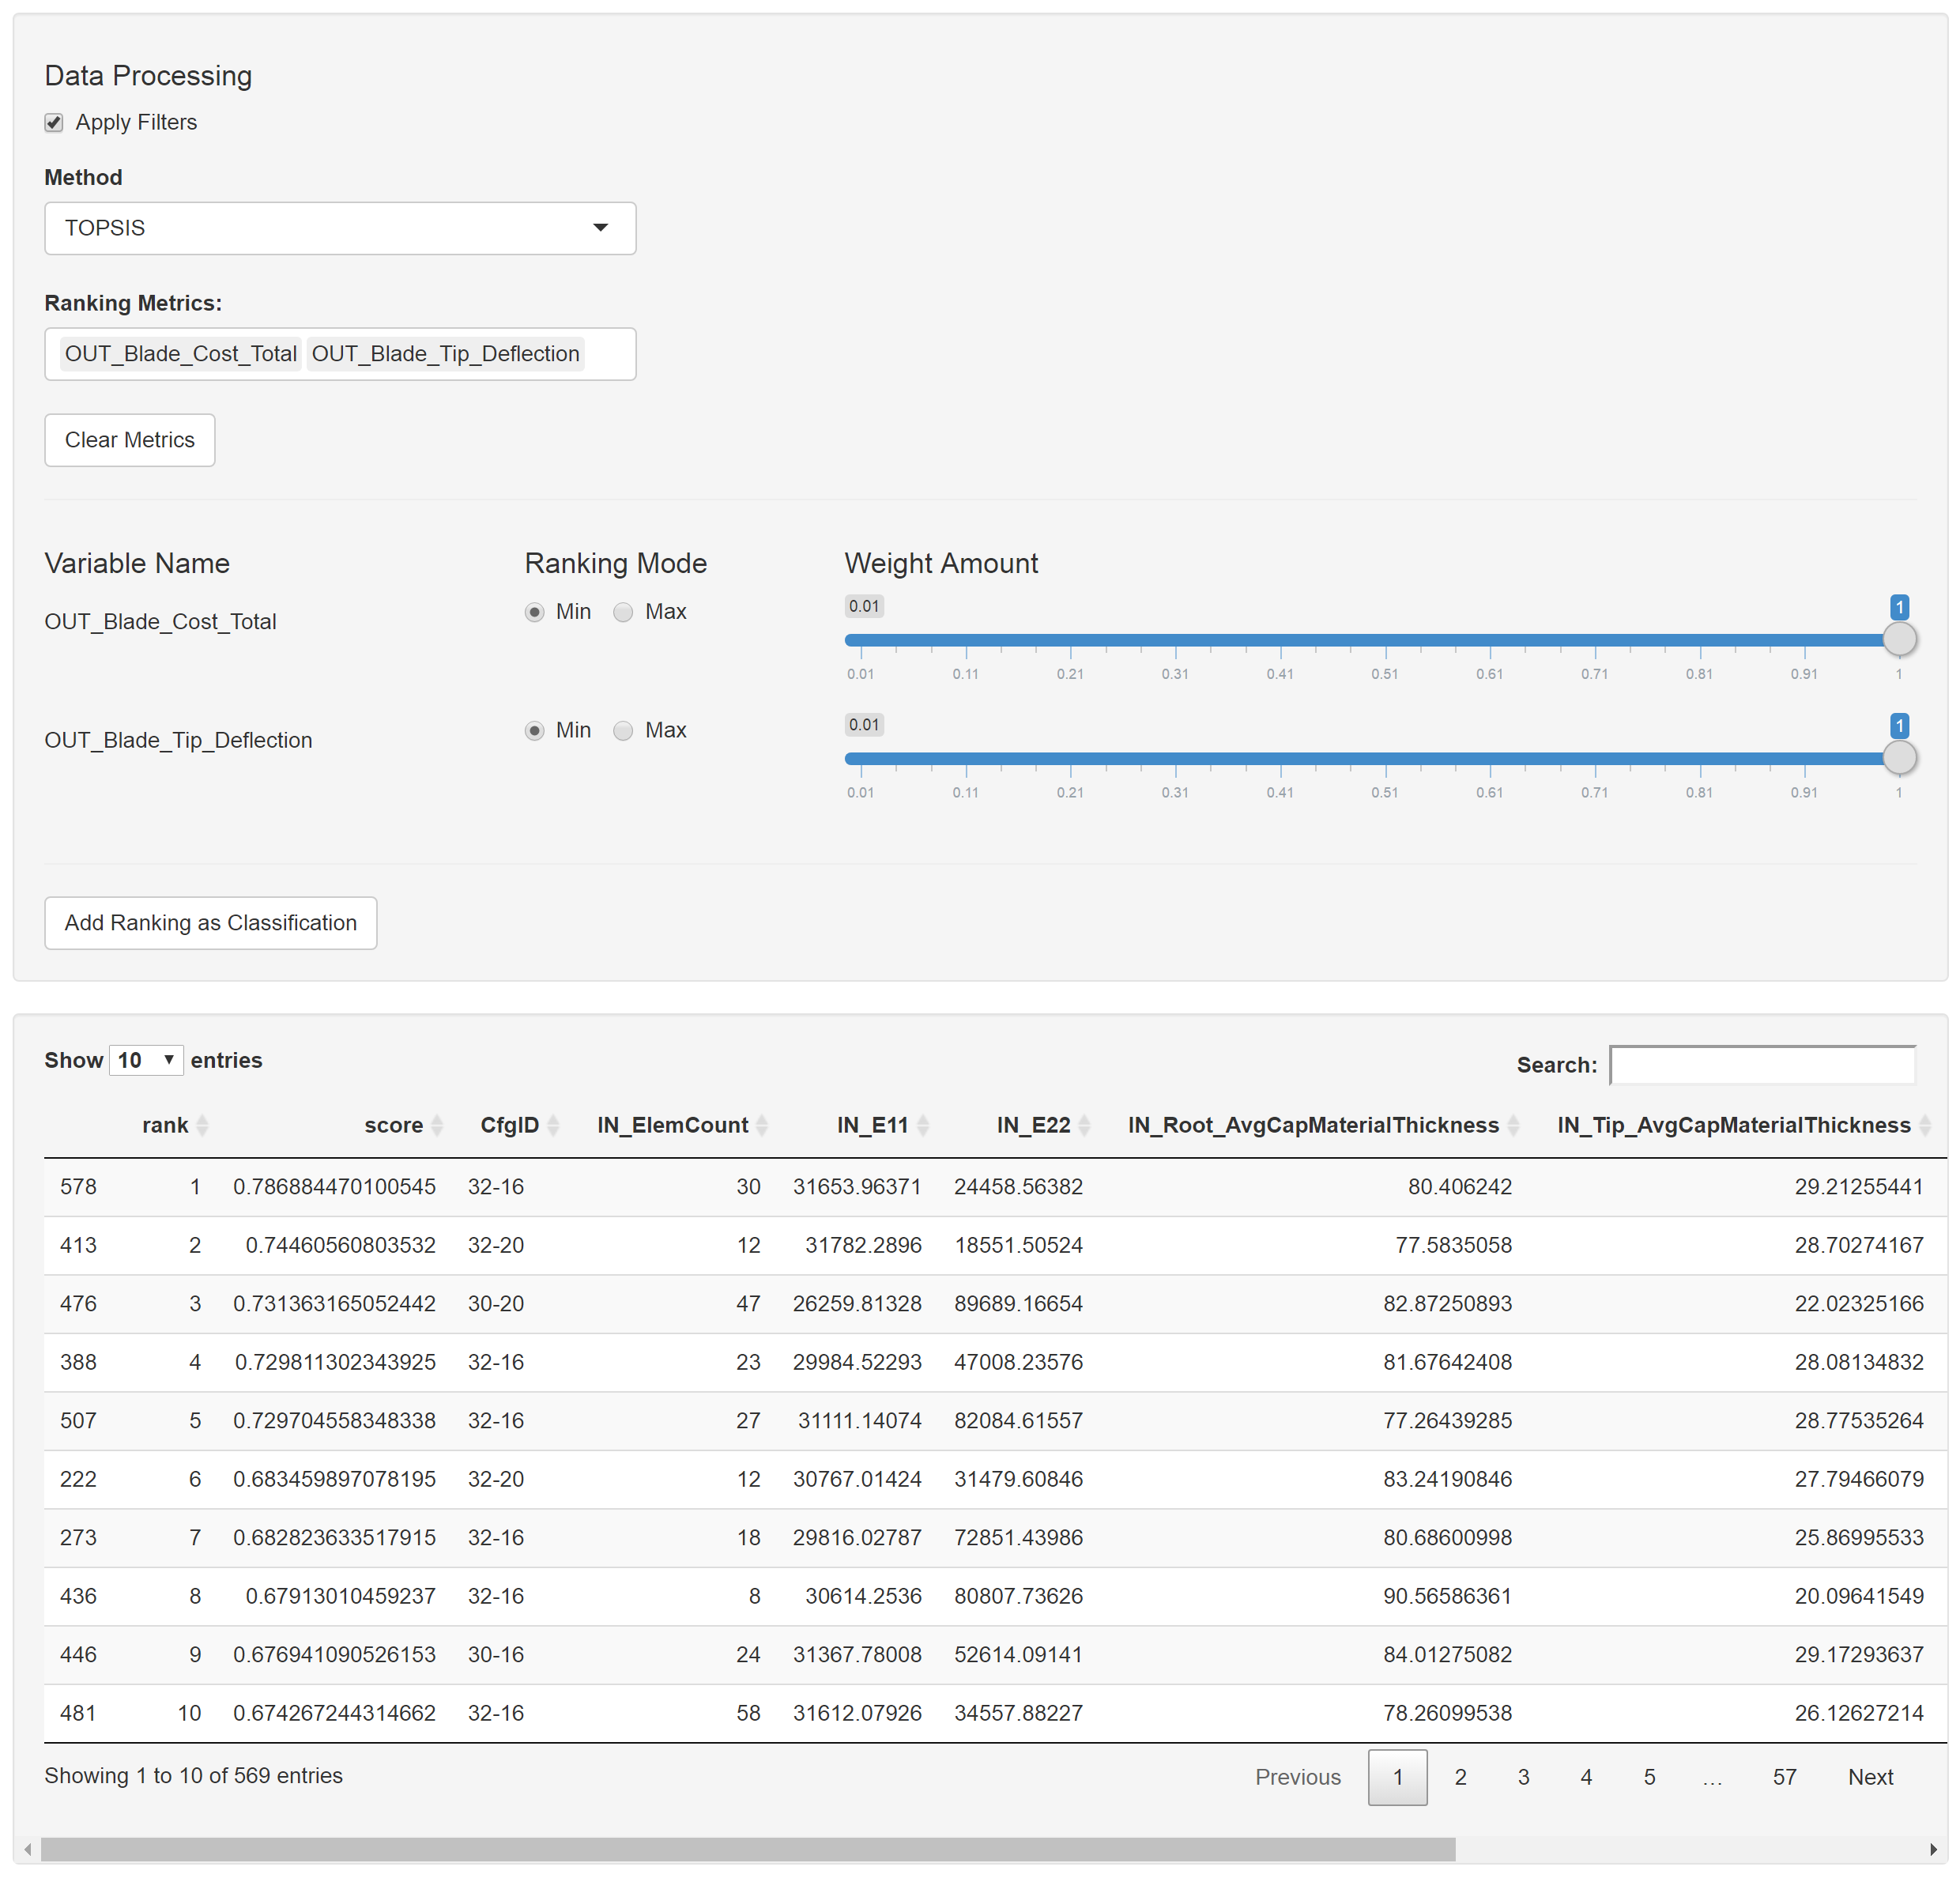
User Interface of the Data Table Tab
Data Processing
- Apply Filters: This checkbox determines whether you are looking at the raw data or data with the global filters applied.
- Method: This select input allows you to select the method, if any, that is used to process the data. Currently the only method that is available is the TOPSIS.
TOPSIS
The Technique for Order of Preference by Similarity to Ideal Solution (TOPSIS) is a multi-criteria decision analysis method, which was originally developed by Hwang and Yoon in 1981 with further developments by Yoon in 1987, and Hwang, Lai and Liu in 1993. [1] We rely upon the implementation available in the ‘topsis’ package on CRAN.
- Ranking Metrics: This select input allows the user to specify the metrics of interest.
- Clear Metrics: Clicking this button resets this tab.
- Ranking Mode: This specifies the objective for each of the variables.
- Weight Amount: This specifies the relative weight of each objective.
The rank and score columns appear when data ranking is being used. The table is sorted by ascending rank. A score between 0 and 1 is assigned to each point based on the results of the TOPSIS analysis.
Adding Classifications
This allows the user to add the ranking column to the global dataset as a classification.
Data Table
The data table itself is interactive and can be sorted and searched.
Footnotes
| [1] | https://en.wikipedia.org/wiki/TOPSIS |